-
Get It
$19.99
$19.99Civil 3D Essentials Book and Practice Files
Civil 3D Surface Styles: : A step by step tutorial guide
Introduction to Civil 3D Surface Styles
Firstly, what is a Civil 3D Surface styles? Well, let's find out in this online training course. Certainly, this step by step tutorial is a part of the Civil 3D essentials book and how-to manuals.
Working with Civil 3D Surface Styles?
Like most entities in Civil 3D, applying a surface style controls the display of the surface. Using a style, we can manage the display of things such as contours and their intervals, triangles, points, slope arrows, watersheds, etc.
Let's see how to apply styles to the surfaces in the drawing. Say we want to display the high and low areas on the preliminary existing ground surface. To do this, we will first need a Style that displays Elevation. We must then decide what range of elevations we will consider high or low ground.
To apply or create a new surface style,
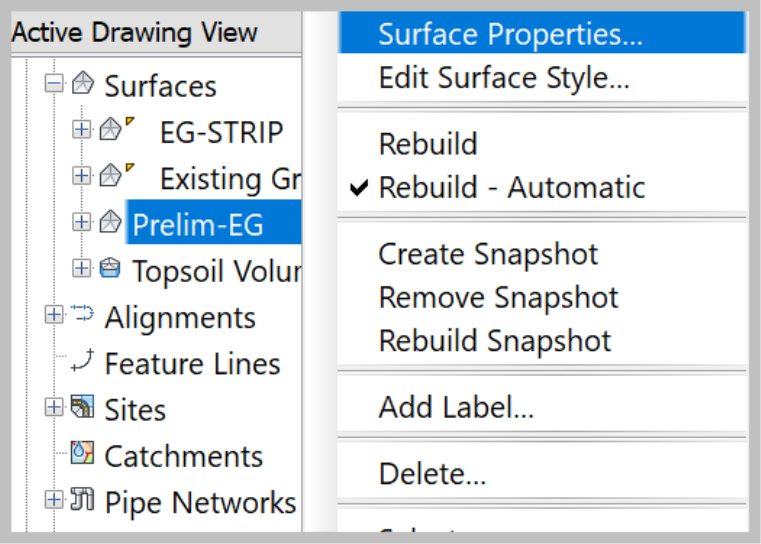
- Select the working surface, Prelim-EG surface, by clicking anywhere on its contours in the drawing, or by selecting it in the Prospector. Right-click then Select.
- Right-click in an empty spot in the drawing area and select Surface Properties.

- In the Surface Properties dialog box, on the Information tab, for Surface Style, select Elevation Banding (2D). This will allow us to display the elevations in hatch (solid or predefined). This will complete the first step in displaying an elevation map.

- Next, we need to specify the range of elevations. For that, click on the Analysis tab, and select Elevation for the type of analysis. The Legend should also be elevation. For Number of ranges, let's choose 5. The default number of ranges and schemes are set in the Analysis tab of the Surface Styles dialog box that we will see later

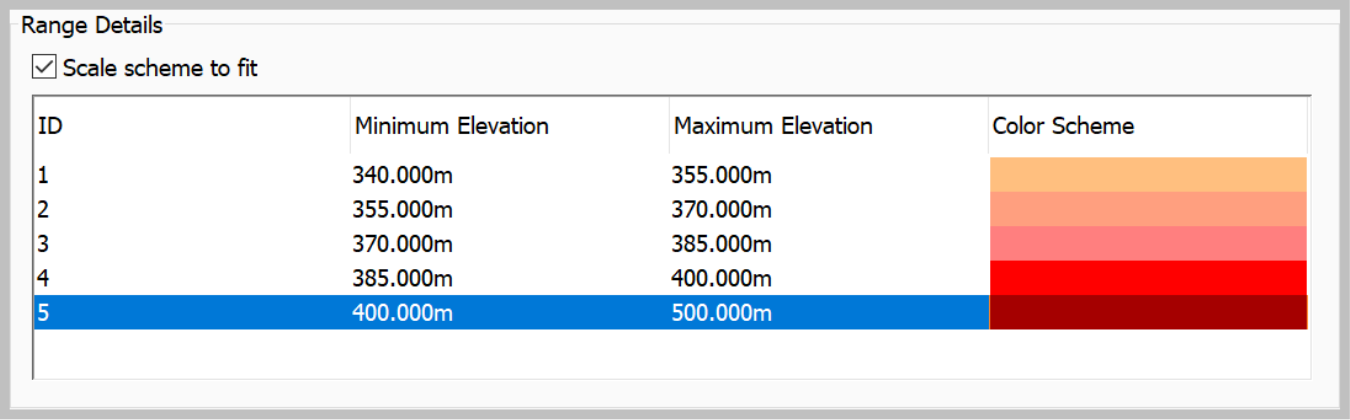
- Click the downward arrow to display range elevations and schemes.

- Let's change the colour scheme and elevation ranges. We may need to make the last Minimum Elevation a little higher, say anything above 400m or 1,300 feet. We can then go at 15m or 50ft intervals for the rest.

- For the color, we can change them individually by clicking on them. Let's choose a gradually intense red color scheme.
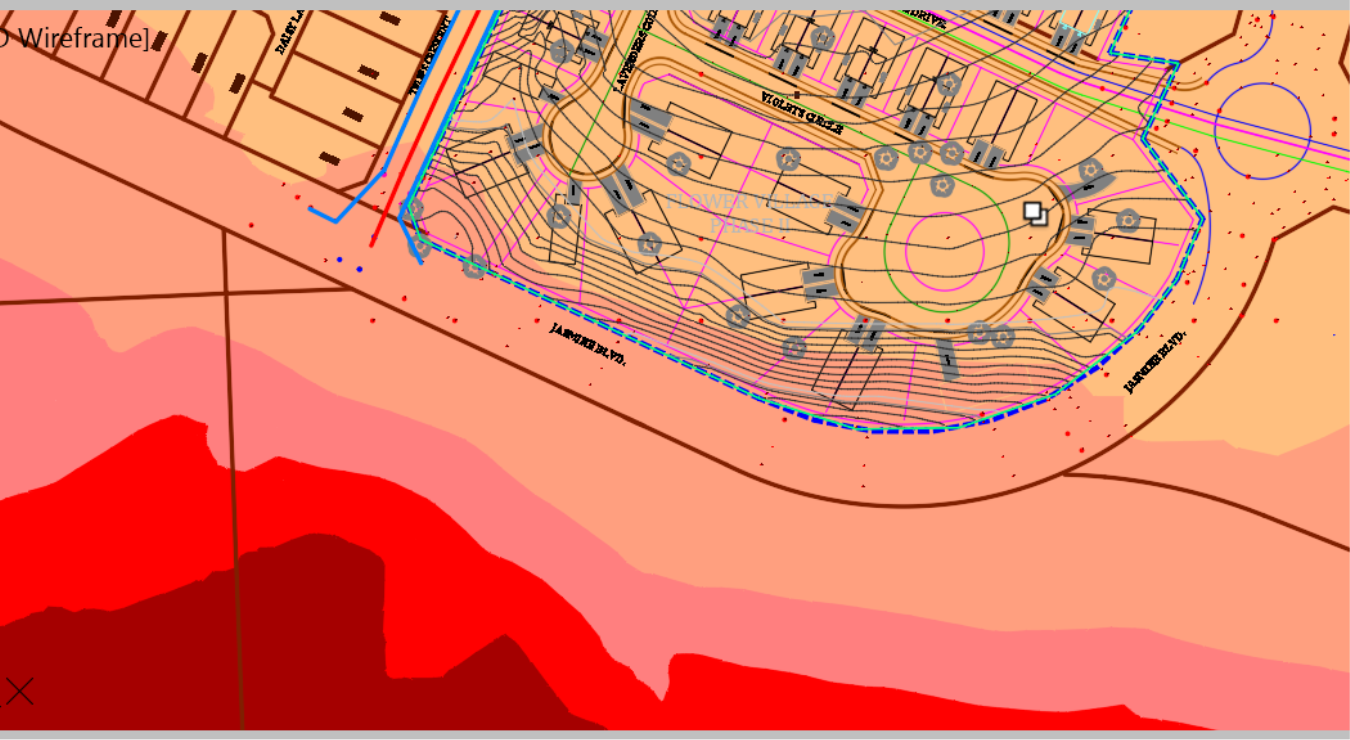
- Click on OK to close the window and observe the changes. The elevations map is displayed in the drawing, and we can differentiate between the high and low ground areas. We can further refine the elevation ranges by increasing or tightening them, to do more analysis.
- Now change the Style back to the Prelim-EGcontoursstyle by selecting the surface. Then go to the surface properties and apply the contours style on the information tab.
- Next, let's see how to Create or Edit Surface Styles. Assume the project reviewing agency requires that existing contours be displayed at 0.25m or 1-feet intervals. To create a style that meets that requirement, we can either modify an existing style or simply create a new one.
- First, hide the Prelim-EG, by applying a No Display style, so that we can easily select the surveyed surface. Select the Prelim-EG surface, right-click and select Surface Properties.
- Next, apply the No Display style and click OK to close the window.
- We also need to repeat the previous steps to hide the EG-Strip surface, since we don't need to display it anymore.
- Now we need to see how to create a Contours Style for the required 0.25m or 1-feet intervals by our reviewing agency. Select the Existing Ground surface and open the Surface Properties window as we just did for the Prelim-EG surface.
- If we click in the Surface Style drop-down box, we will see a list of all styles available in our drawing. We can simply pick one and apply it to the currently selected surface. Unfortunately, we don't have the one required by the reviewer, the 0.25m or 1ft contour. So, let's create it.
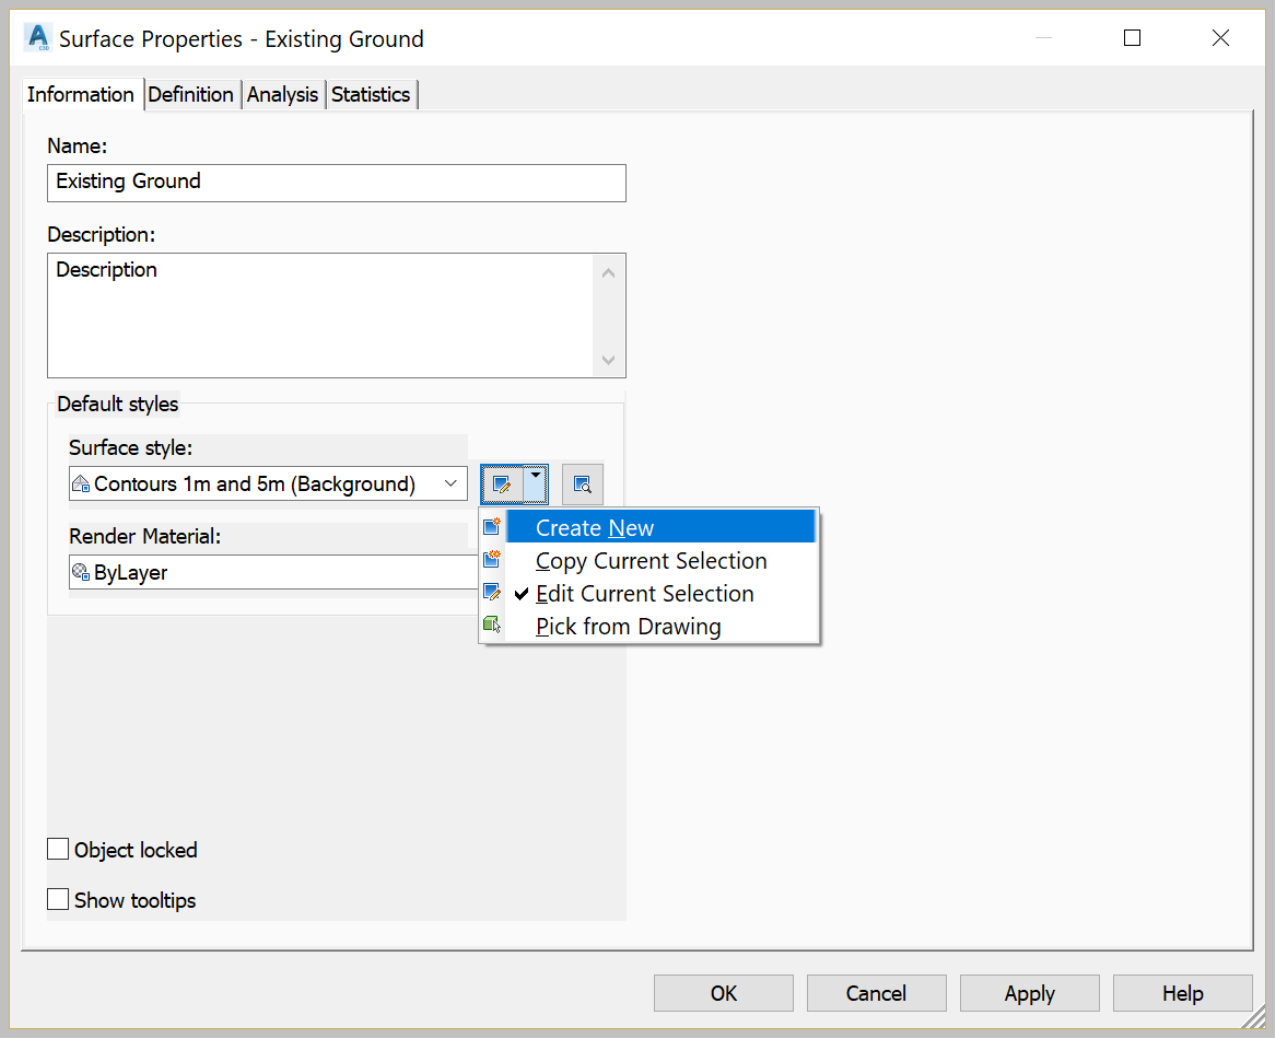
- Click on the downward arrow to the right of Surface Style dialog box and click on Create New. Note that we could also select Copy Current Selection to copy the currently active style and then modify it to meet our requirements. That would be a smart thing to do if we have settings in that style that we want to copy over. This case actually fits our current situation, since we only need to change contours intervals. Nonetheless, let's create a new style so that we can learn how to do it.
- In the Surface Style window, first, start with the Information tab. It has a record of the surface identification, including the surface style name, description, dates, and authors of the modifications.
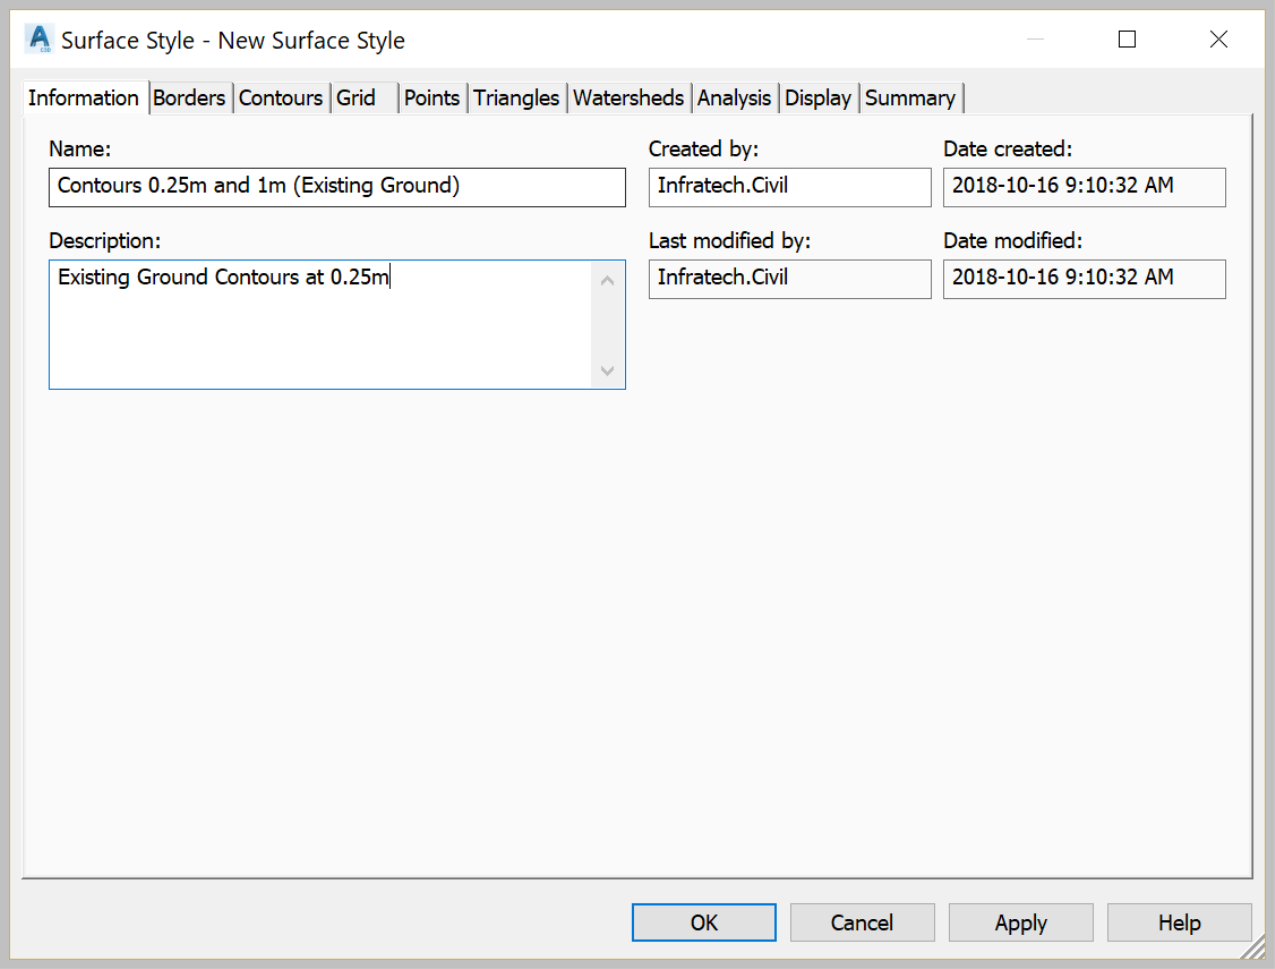
- That takes care of the surface identification. The most important information we need next is the contours intervals. But before we do that, let's explore what is on the other tabs and what they can help us accomplish later.
- The next tab is Borders. It specifies the settings for the surface border, which display the extents of a surface. It should not be confused with Boundary in the surface definition. A boundary is a physical object, most of the time a polyline, that helps define a border.
- Up next is Contours, the tab we are looking for to create our style. Most of the time you only need two areas in this tab. The first is the Contour intervals and the second one is the Contour Smoothing, used to smooth contours and display them as more polished polylines. Let's open the section by clicking on the + sign close to Contour Intervals. The section extends, and we see three lines. The base elevation which specifies the relative base elevation for the major contours. That means the contours counting will start from here. It should always be set at a lower elevation. Otherwise, contours will be missed. We then have the Major and Minor contours. Now, set the Minor Interval at 0.25m or 0.5ft as required, and the Major Interval at 1m or 3ft.

- On the Grid tab, we can specify the settings for the grid lines. Should we want to display our surface in grids, say cells of 50m by 50m or 150ft by 150ft.

- On the Points tab, we can set the settings for points of the surface entities. These are all the points used for the surface triangulation, cogo points, breakline vertices, etc.

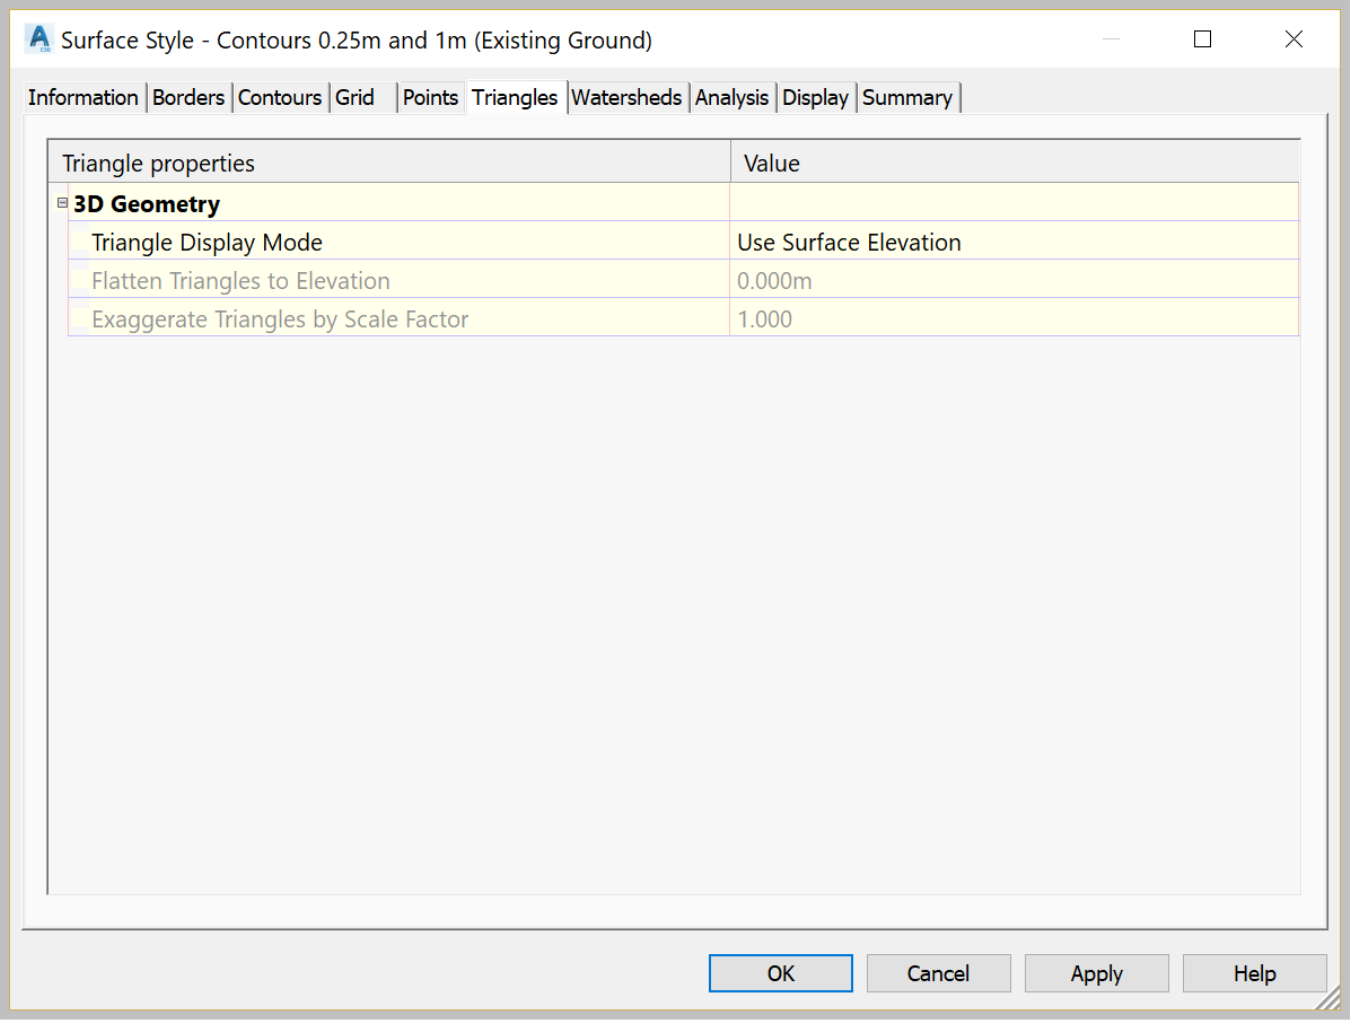
- Next is the Triangles Tab, which specifies the properties of the triangles that constitute the surface.
- We then have the Watersheds tab, used to analyze how water flows along and off a surface.

- Then we have the Analysis tab, which specifies the display parameters for the surface analyses. We've seen an example of surface analysis when we created the Elevation Map. This is where the colour and range defaults are managed. So, any time you are doing analysis, this is where you should look for the parameter settings.

- Then, probably the most important tab is the Display tab. This is where we put it all together by deciding what needs to be visible or not, among all the components that make up a surface. We can change the visibility, colour, or layer for the surface components at any time. Now, let us set the display settings for the surface style. Since this is an existing ground style, we want to usecolours that will print light in our plot style file, say 9 for major contours and 8 for minor contours. We also want to make them dashed. By convention, we will display existing lines in a dashed pattern and proposed lines in continuous linetype. Let's set it to 0.2-line type scale, and for line lineweight, we will use 0mm for major contours and 0.35mm for major contours. This pretty much sets up our style.

- The last tab gives us a summary of most things we've talked about in this window. Modifications can be made here as well.
- Let's click OK twice and see how our style does. Remember, creating styles is a tried-and-true process. You need to get something that looks good, prints well and meets requirements.
- Looking in, our style doesn't look too bad for a first trial. Maybe we just need to adjust the linetype scale to show the dashed lines a little better.

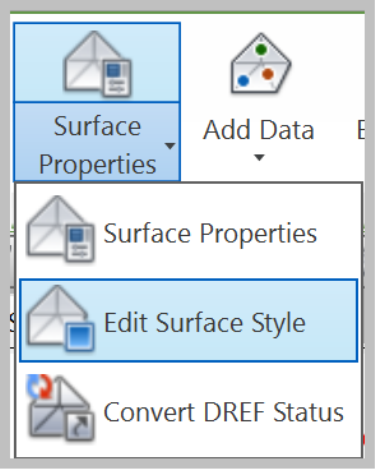
- Let's go back to the surface style display tab and adjust that. Select the surface, and on the ribbon click on Edit Surface Style. As you can see, we've been using the right-click options, but you can also access these commands from the ribbon. It all depends on which option is easier for you.
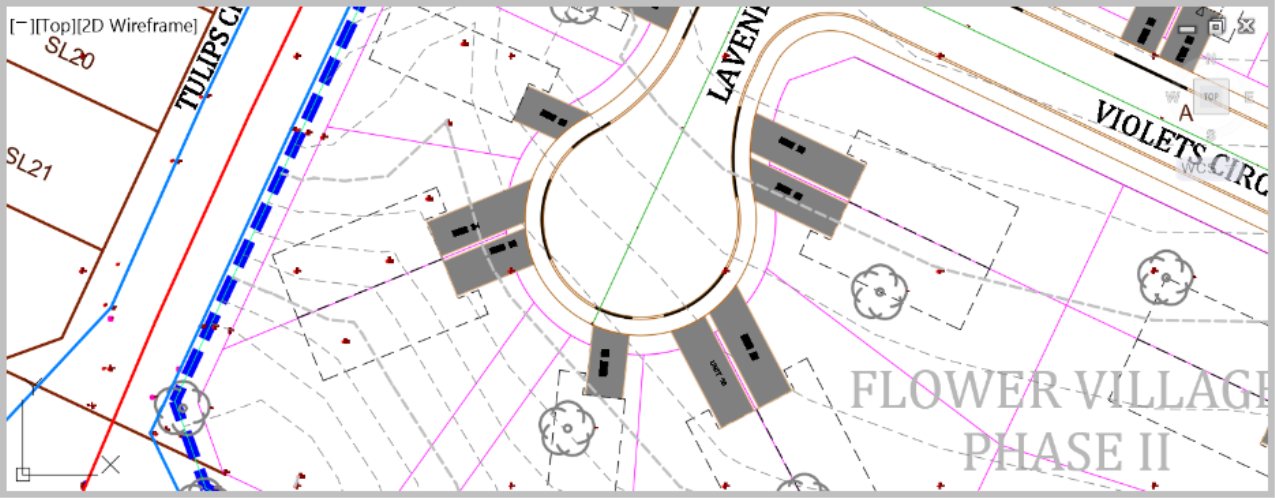
- Now on the Display tab, change the LT Scale from 0.2 to 2 and click OK to close the Surface Style window. Now we see the contours dashed lines appear much better.
- In summary, this is how you create a surface style. Should it be for contours, points, elevations or slopes, the process is the same. First, go the component tab to set the parameters, and manage the visibility on the Display tab. That's pretty much all for Surface Styles. The same process works for alignments, profiles and many other objects, with few differences.