-
Get It
$19.99
$19.99SSA Stormwater Book and Practice Files
Storm and Sanitary Design Tutorial: IDF Curves
Rainfall IDF Curves
Product: Autodesk SSA | Subject: Storm and Sanitary Analysis
In this exercise, we will learn about Rainfall IDF Curves.
Rainfall IDF Curves
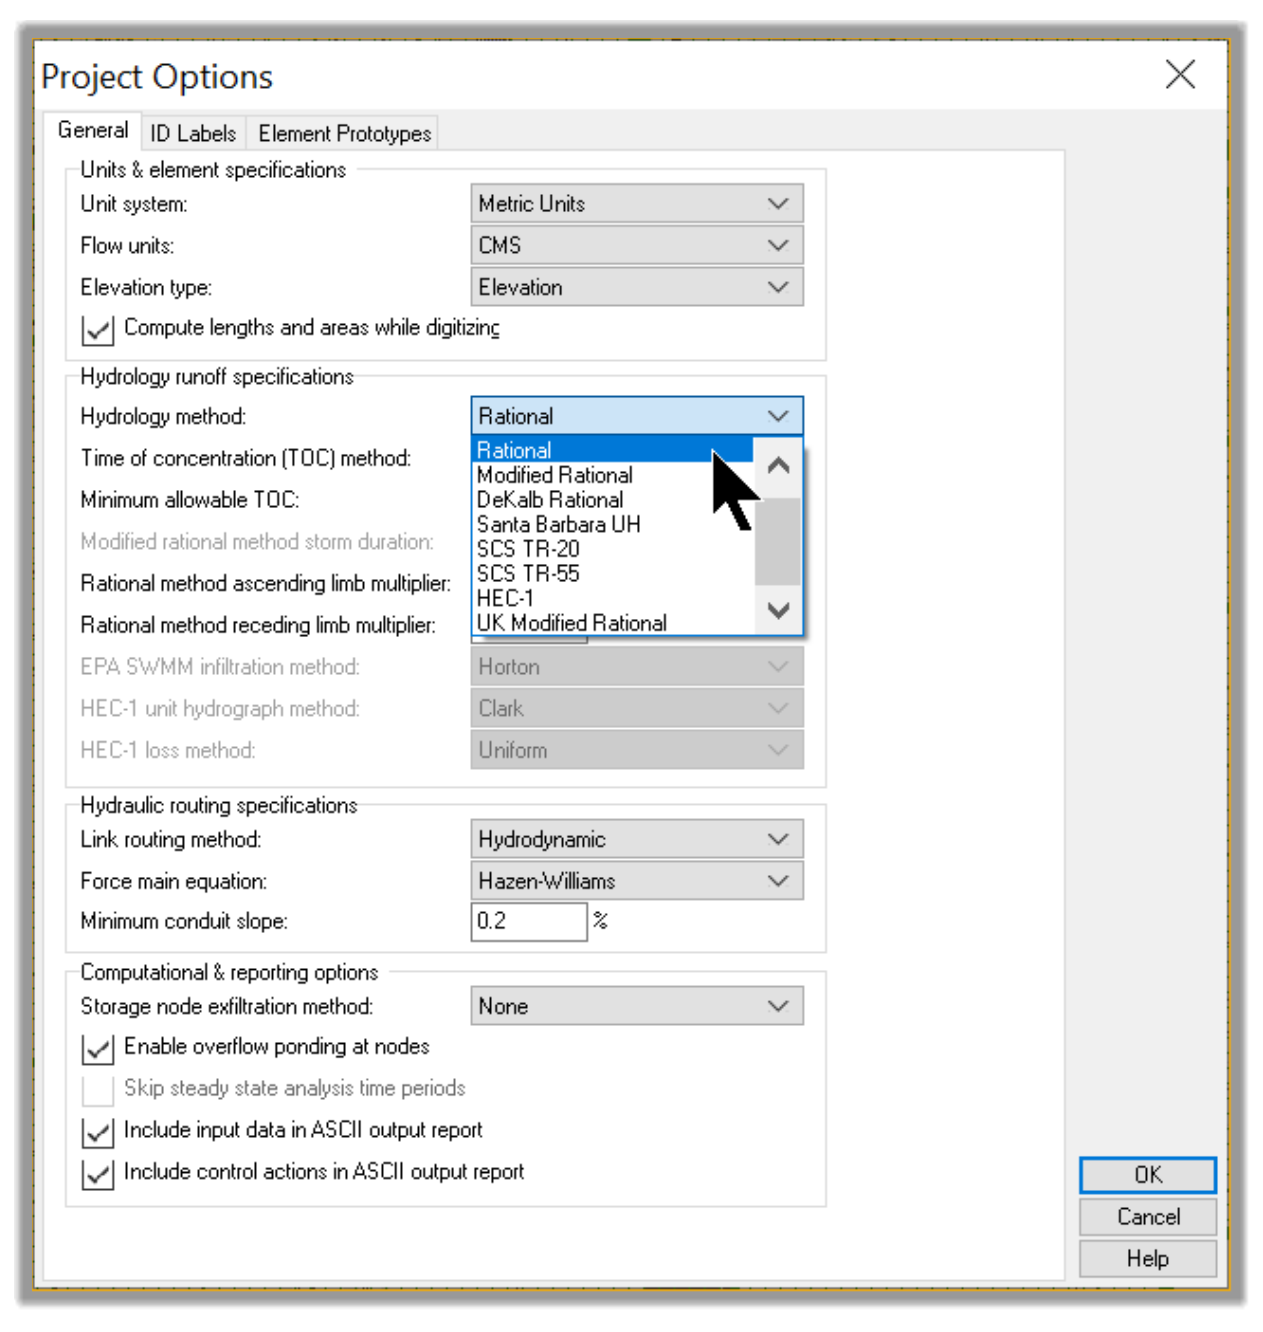
The next item on our list is designing the rainfall data. You will notice, depending on the Hydrology method we choose in the Project Options window, that we will have either a Rain Gage or IDF option in the Data Tree.
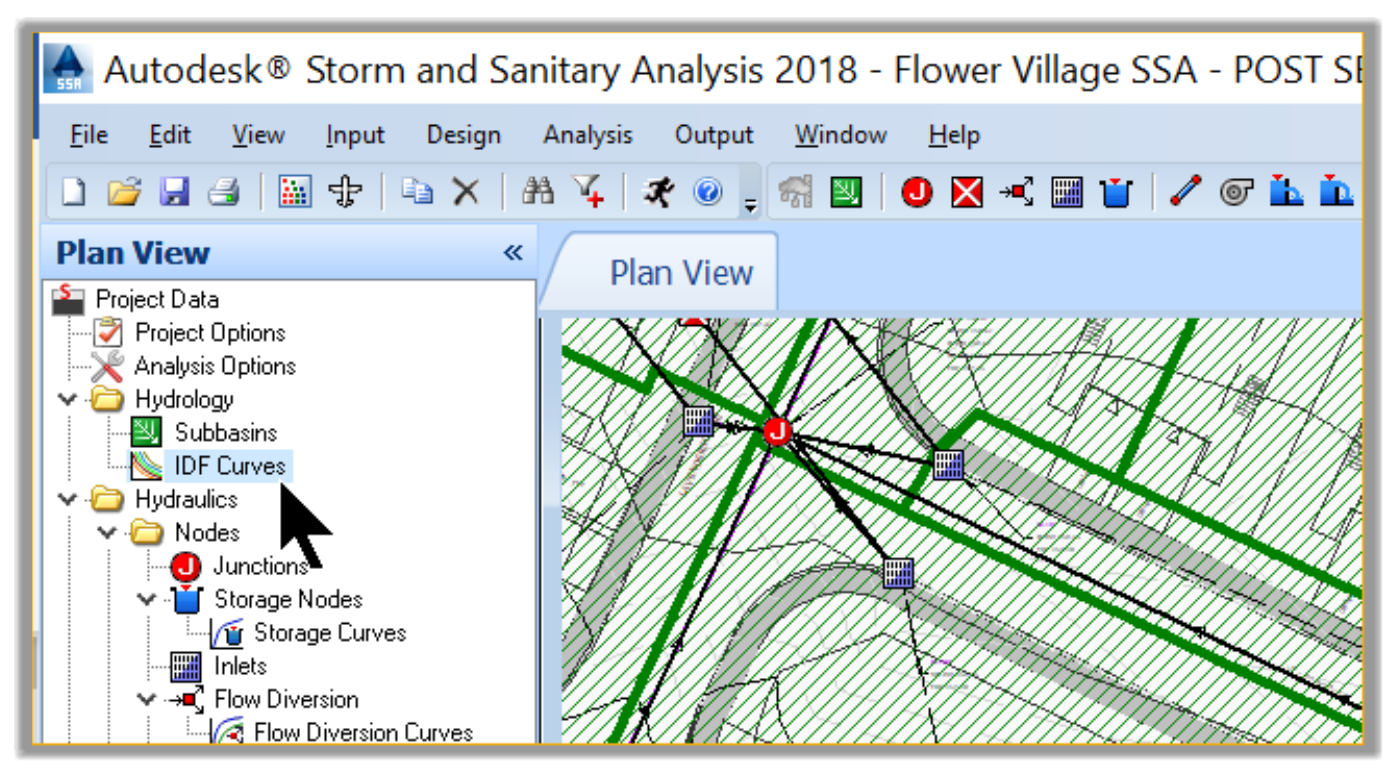
Currently, we have IDF Curves because we are running the Rational Method as our Hydrology Method. When we switch to TR-55 for the detention design, the IDF Curves will be replaced by Rain Gages in the Data Tree. Let’s verify that by going back for a second and change the hydrology method to the Rational Method.
- Keep working from the same file or open the file 04.03-SEWERS-Hydrology-Rainfall.spf.
- In the data tree, double-click on Project Options.
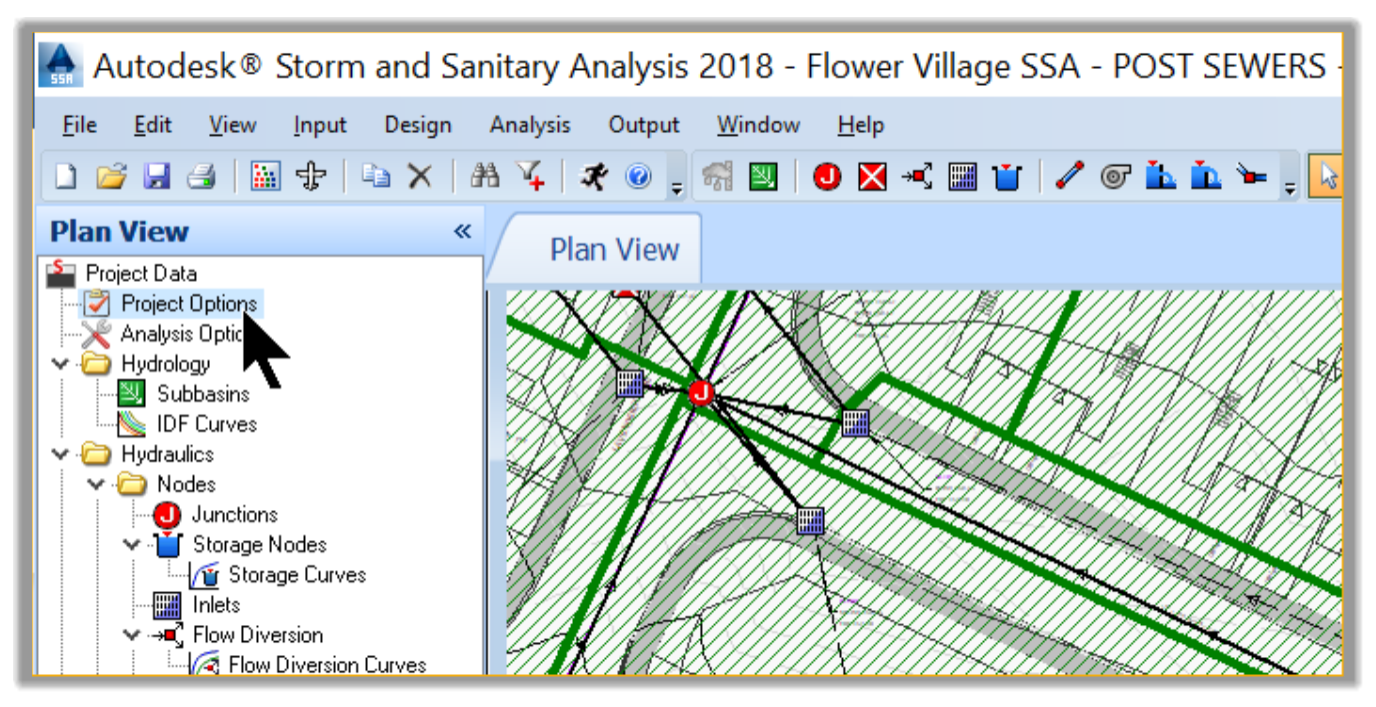
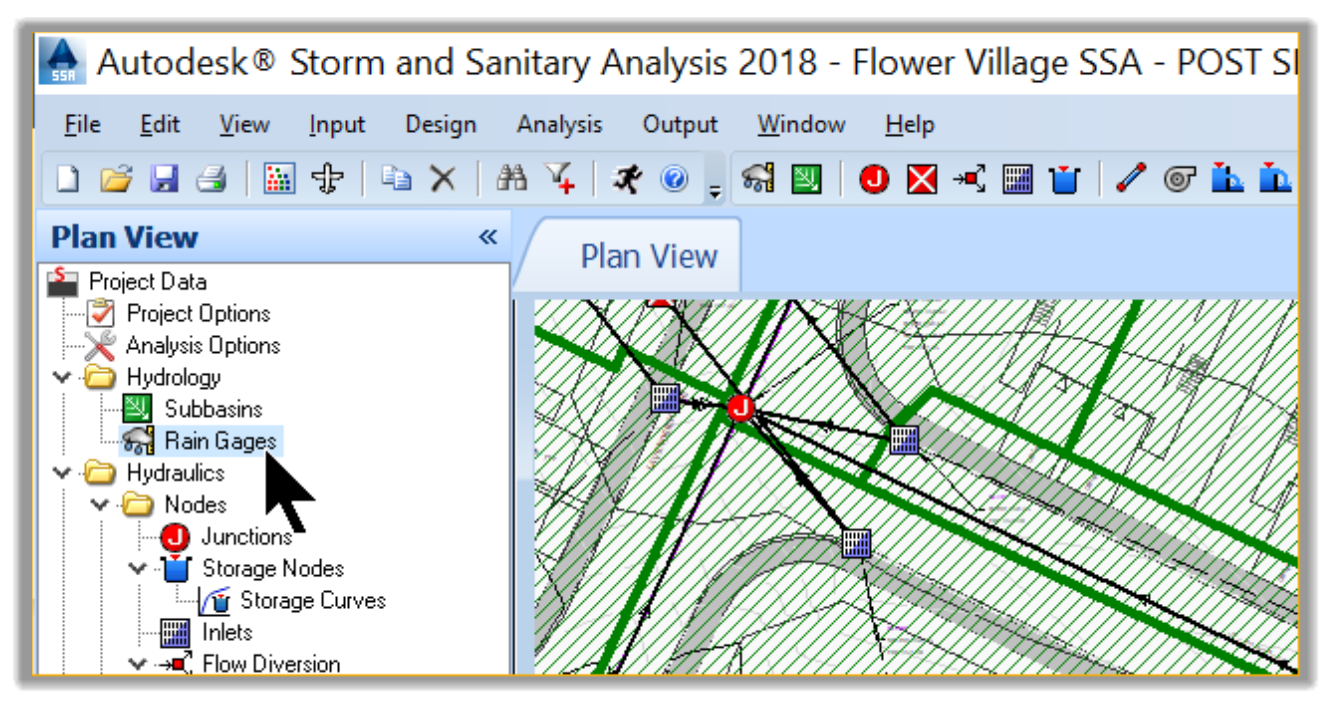
- In the Project Options window, change the Hydrology Method to TR-55.
- Notice how the rainfall changes from IDF to Rain gage? The reason is simple. As we have previously explained, the rational method is not for an extended period design. Therefore, it does not use a rain gage. Instead, it uses IDF Curves, which gives rainfall Intensity values at specific points in time called Duration, for a given return period or frequency. On the other hand, rain gages give us extended rainfall data, up to a few days. Typically, the extended rainfall is collected over a period of 24 or 48 hours.
- Now, let’s go back to the project options and make sure we have the analysis method set to the Rational Method.
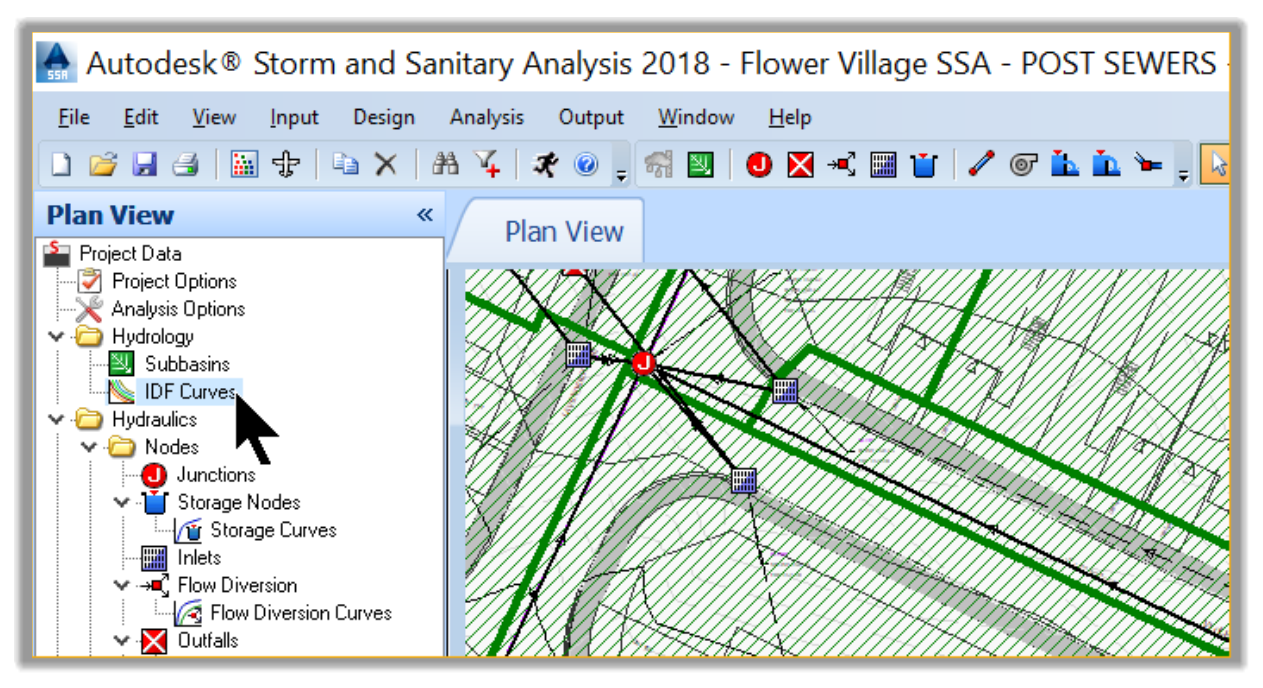
- The Data Tree now shows IDF Curves instead of Rain Gages. Now, double-click on the IDF Curves element.
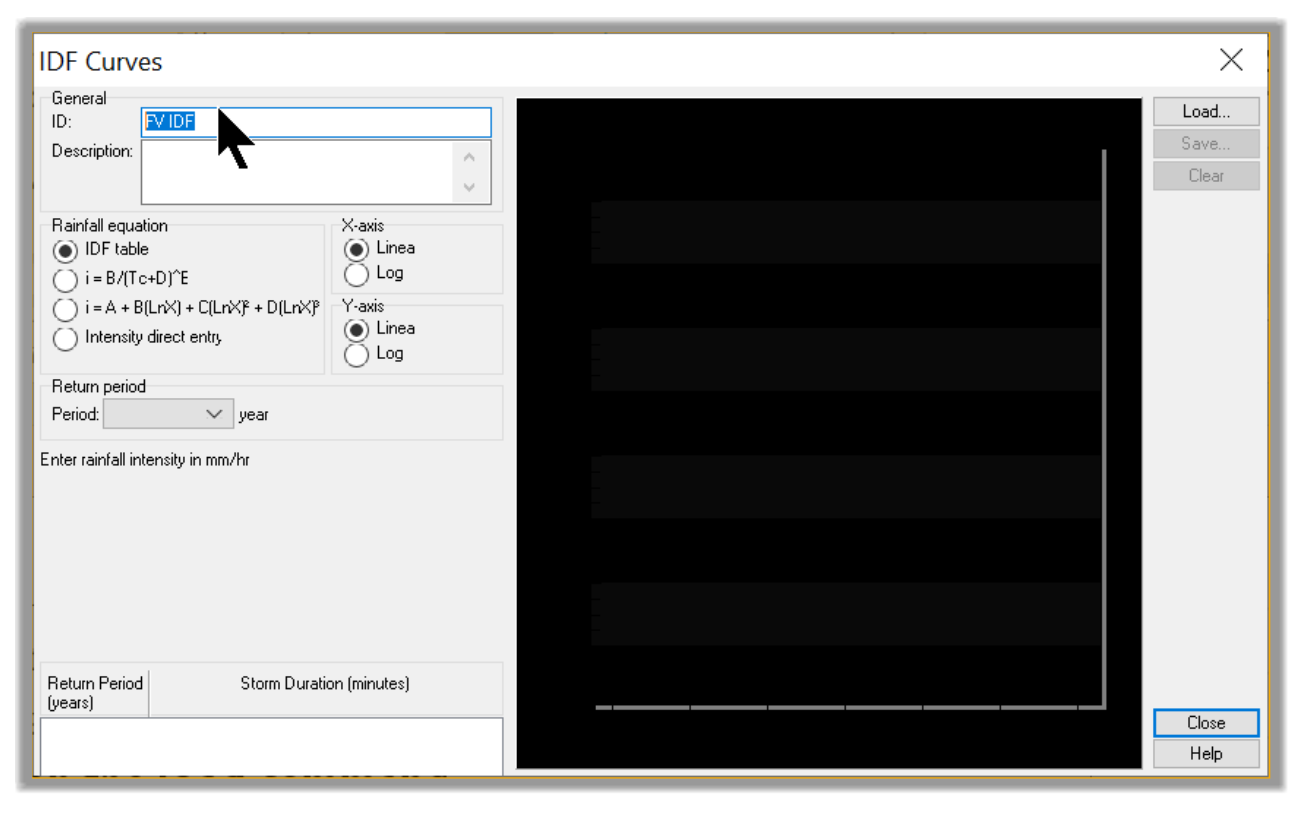
- The IDF Curves Designer opens. We have two options for designing the IDF curve for our project. The first option is to upload a pre-existing IDF file. To do that,
1) First, let’s rename the IDF Curve to FV IDF.
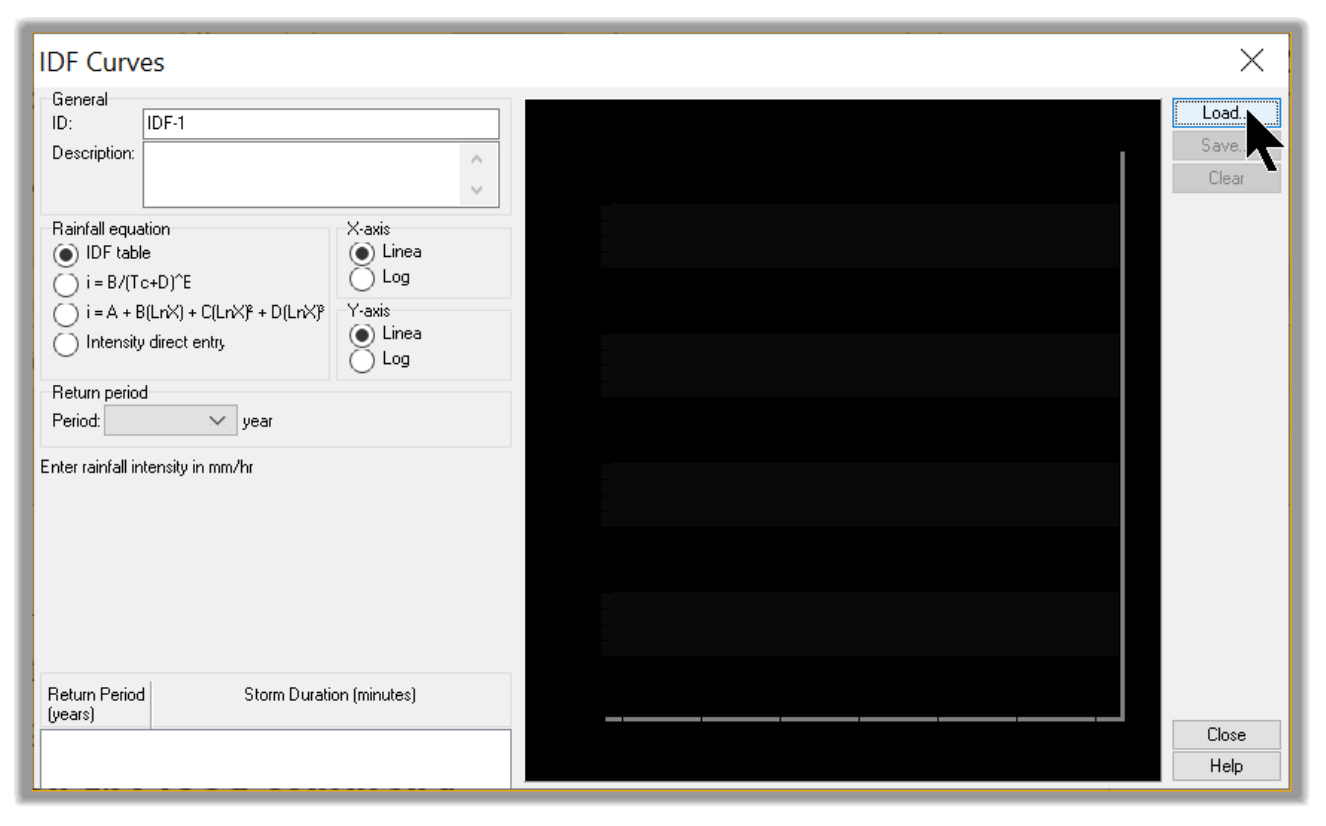
2) Next, click on the Load command to upload our IDF file. We will see later how to create them.
3) We are automatically directed to the default location of IDF file databases.
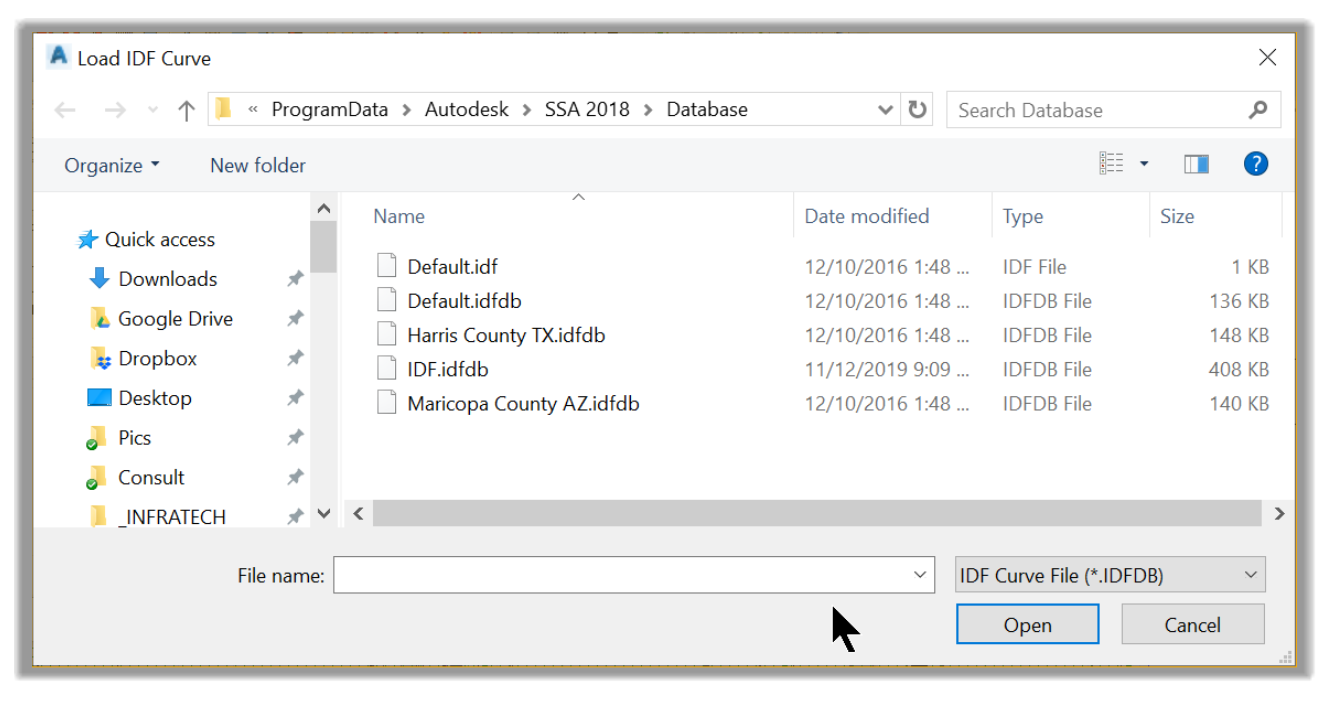
4) Now, let’s navigate to the practice folder and select our IDF file for the project. Alternatively, we can load any of these files and adjust them to meet the rainfall data in our site region. To do that, we will need to have the real data readily available.
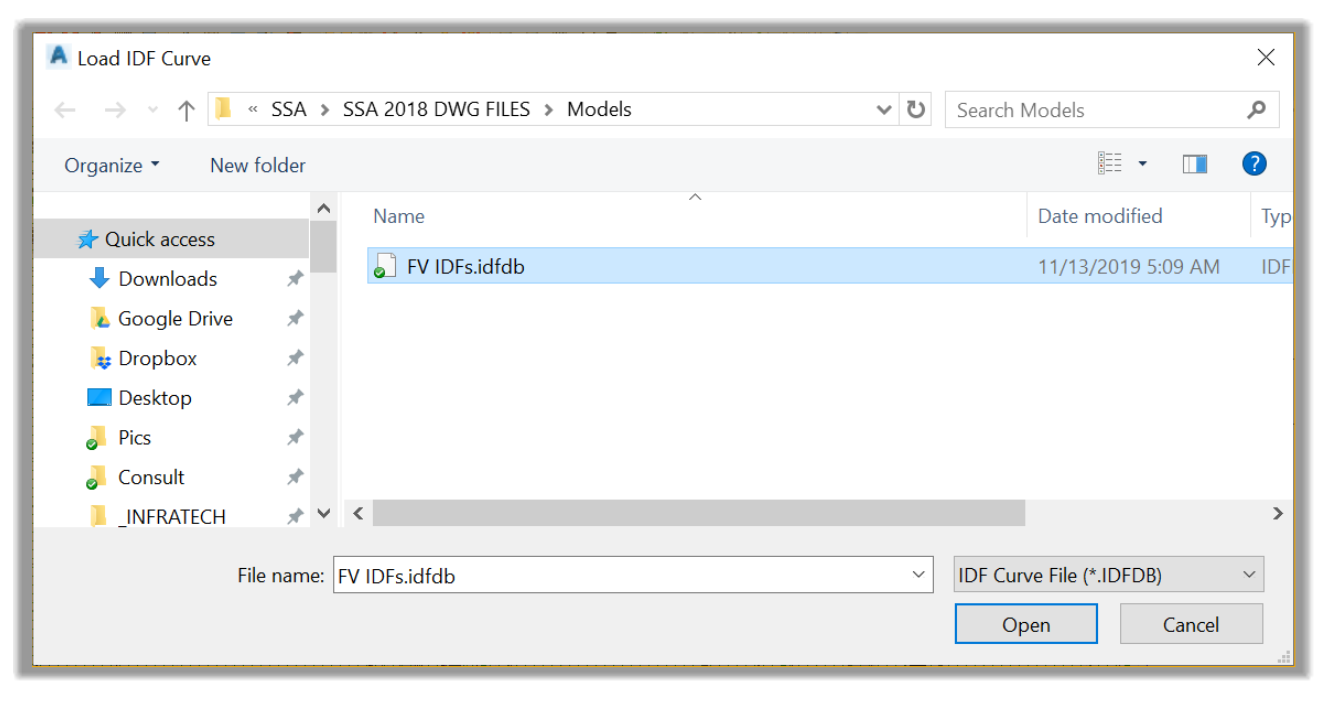
5) Click Open. The IDF curves for the project are now loaded. We can see that we have the data for storm frequencies of 2 to 10 years and 5, 15, 30 and 60-min duration.
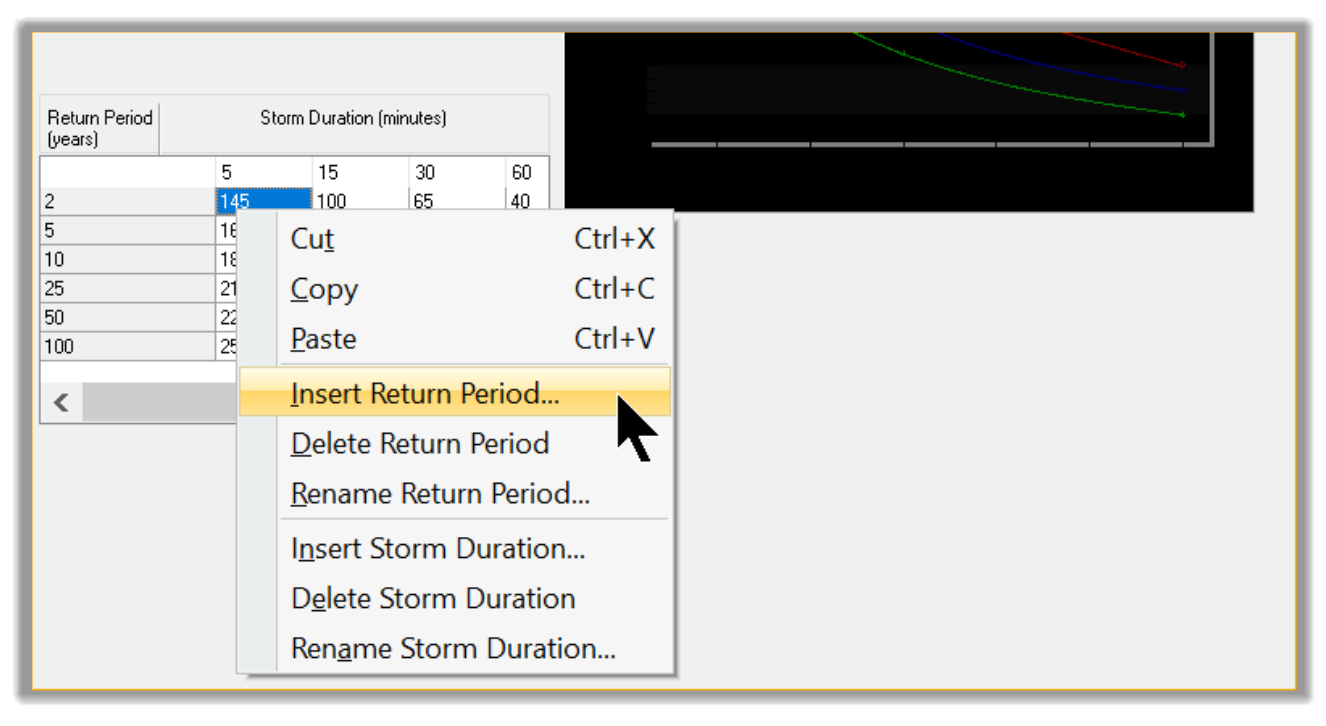
6) The second way to get IDF data into SSA is to simply type them. We can add or remove storm durations and frequencies by right-clicking on the table and choosing the desired operation.
7) Once we typed-in our IDF data, we can save the file for future use by clicking on the Save command. This is exactly how the file we loaded previously was created.
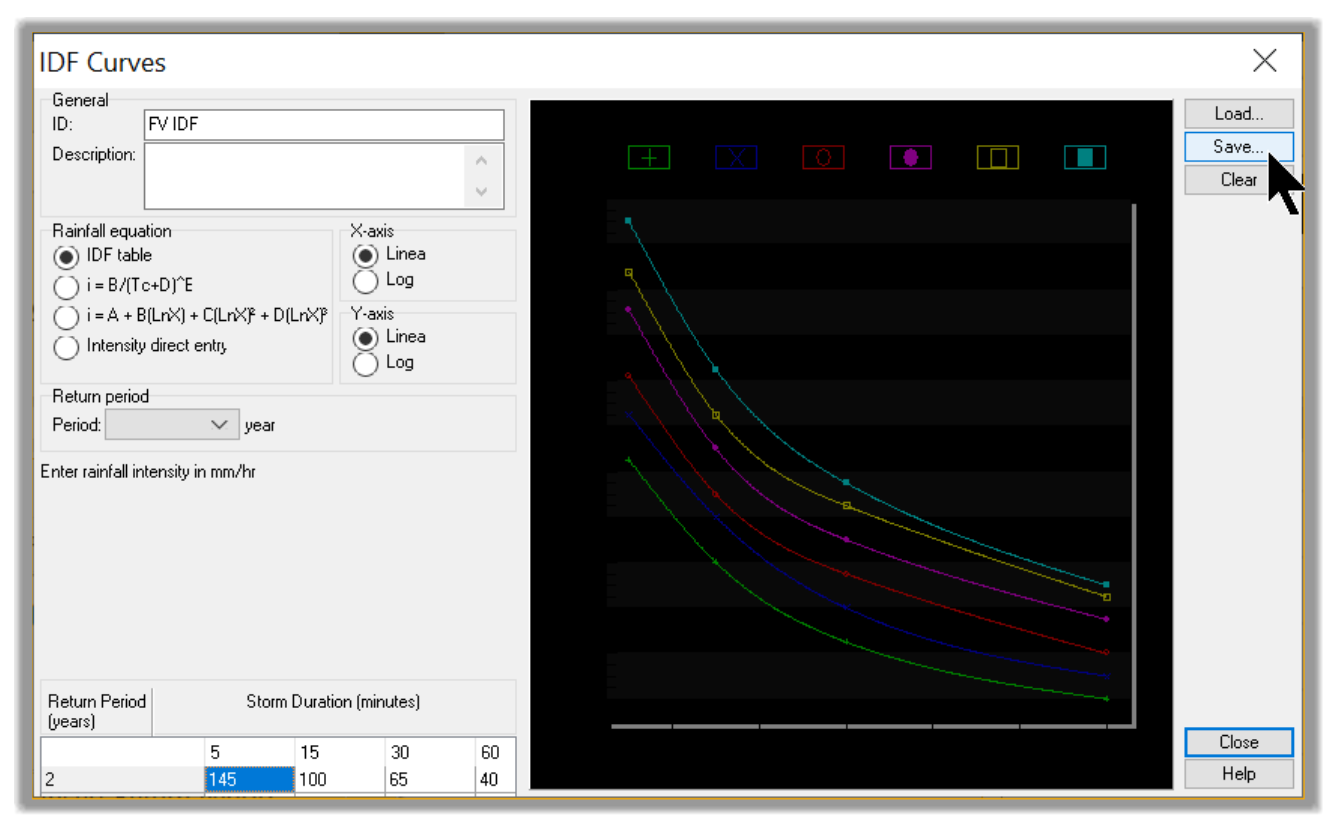
8) Our IDF Curve has data for different frequencies. Since we are doing the Storm Sewers analysis, which requires the 10-year frequency, we are going to pick that Return Period in the list.
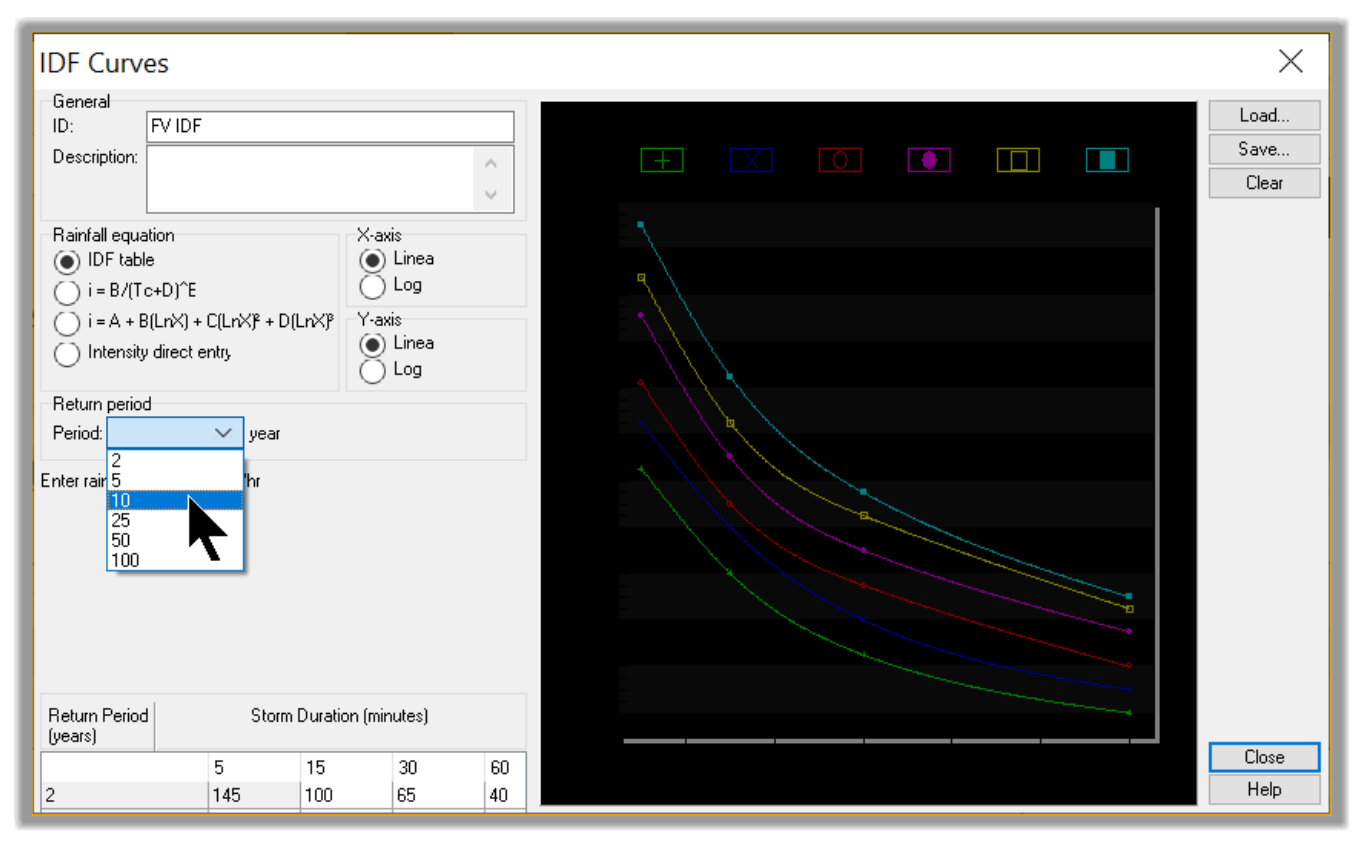
9) Before closing the window, we need to mention that the IDF curve can also be generated using known empirical statistical formulas or by specifying X and/or Y-axis graduation as linear or logarithmic.
10) We are all set and can now Close the IDF designer.
This wraps up the setup for the Hydrology sections. Up next, Hydraulics.
Full Course and Free Book
-

SSA Stormwater Book and Practice Files
Course4.9 average rating (31 reviews)This pdf book includes the training manual and practice files for the advanced AutoCAD Civil 3D Storm and Sanitary Design course. This manual covers the skills needed to successfully design and analyze stormwater detention and sanitary sewer systems.
Purchase$19.99
-

Civil 3D Storm And Sanitary Analysis
Course4.9 average rating (14 reviews)In this Online Storm and Sanitary Analysis (SSA) training course, participants will learn and apply the tools offered by SSA, the Civil 3D companion software for stormwater management and design.
$99 / year