-
Get It
$19.99
$19.99SSA Stormwater Book and Practice Files
Storm and Sanitary Design Tutorial: SSA Profile Plots
Stormwater
Product: Autodesk SSA | Subject: Storm and Sanitary Analysis
In this exercise, we will learn about stormwater SSA Profile Plots.
Profile Plot
One of the best tools for analyzing a pipe network is to run a profile analysis. Let’s do a profile plot of the Rose Drive leg, to see what is causing the system to be surcharged.
- Run the Profile Plot command from the toolbar.

- Then, click on the first manhole DM.101.
- Next, click on the outfall.
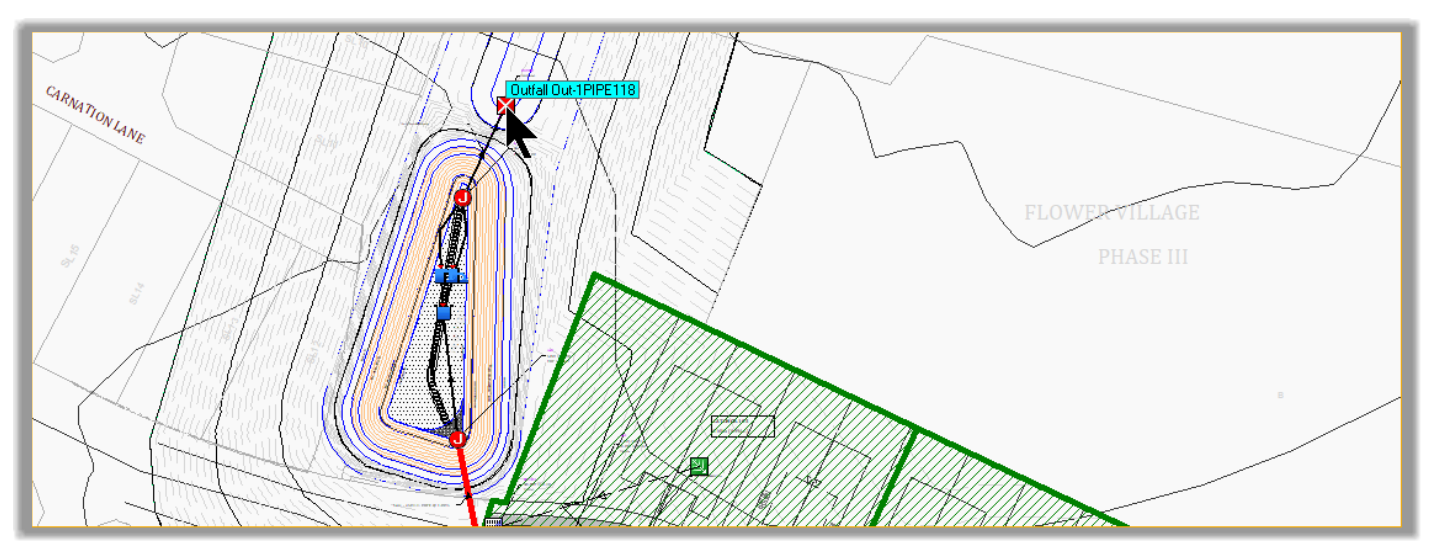
- The profile run is highlighted.
- Next, click anywhere in plan view and select Show Plot.
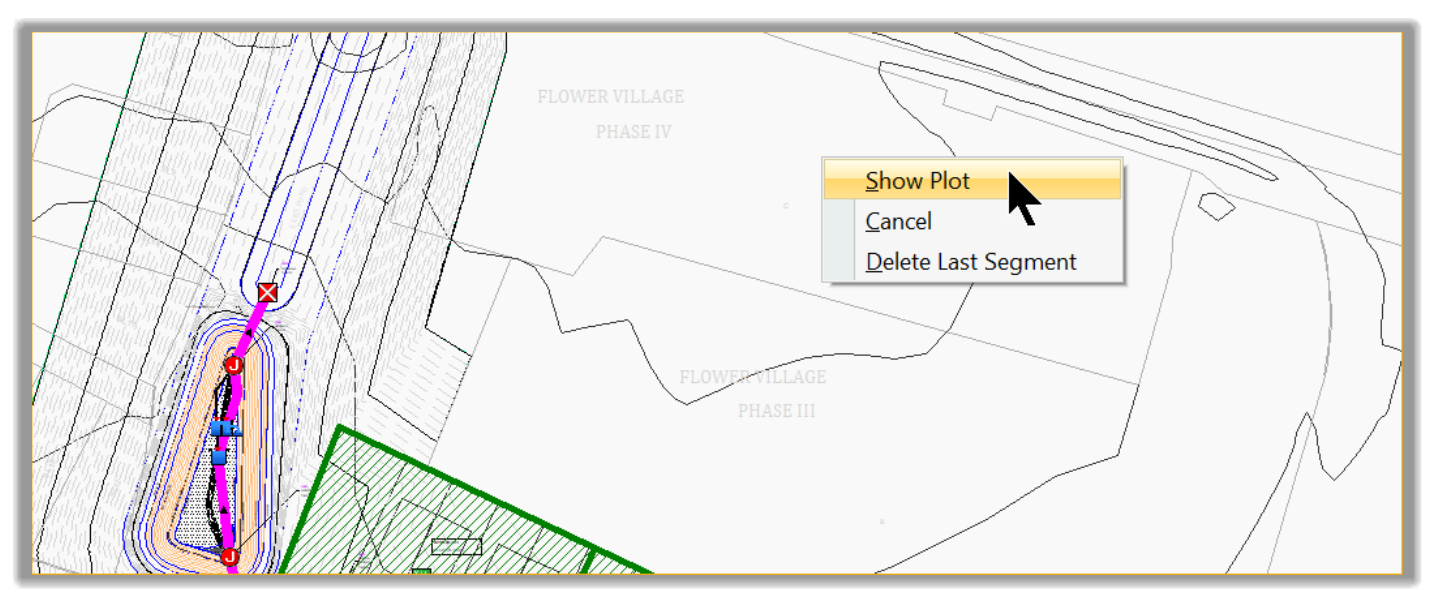
- The profile plot is shown with the Hydraulic Grade Line (HGL).
- Under the profile, a table provides the information for each pipe and structure, including Rim elevations, inverts, HGL, length, slopes, etc.
- Next, by analyzing the profile, we can see that the pond’s incoming pipes are probably a size or two too small.
- Usually, we can solve the issue of surcharge by changing the slopes or pipe sizes. The pipe size is usually our first option.
- Switch to the Plan view tab.
- Now, let’s increase the pipe sizes one size, going upstream, from the pond incoming pipe. Double-click on the first surcharged pipe.
- With Conveyance Links window, change the Diameter from 450mm or 18in to 525mm or 21in.
- Click close to return to the plan view
-
Run the analysis again
 . We can see that the pipe is still surcharged. Let’s go back and increase it by one more size. This time choose 600mm or 24in.
-
After running an analysis
 , we can see now that the pipe is no longer surcharged.
 - Next, move up the chain to the next surcharged pipe (between DM.104 and DM.105).
- That pipe will need a 525mm or 21in to carry the 10-year flow.
- Same for the next pipe between DM.103 and DM.105.
- The next pipe, between DM.103 and DM.106, will also necessitate a 525mm or 21in.
- Now, the only remaining pipes are some catchbasin leaders. We have them at 300mm or 12in. Let’s increase them to 375mm or 15in.
- Double-click on each of the surcharged pipes and change each one.
- We can notice that while two are good to go, three more pipes are still surcharged.
- Let’s increase those one more size to 450mm or 18in.
- The whole system is now flowing in gravity mode, with no surcharged pipe.
- If we switch to the Profile Plot tab, we can see that no pipe is surcharged. The HGL is now contained inside the pipes.
- We have now satisfied with the requirements of the Storm Sewers design, which entails that no surcharges should occur during the 10-year storm event.
- We can now move to the Detention design. However, before doing so, we need to save our work.
- Since we will be working from the same file in order to take advantage of the work we have already done, we need to create a copy for the detention analysis. Under File, select Save As and save the project under the name Flower Village SSA - POST DETENTION - 100Y-TR55 Analysis.spf. The naming of the file makes it explicit that it is for the design of the detention system, which requires the 100-year storm event. The hydrology method for the detention analysis needs to be one that uses a hydrograph method rather than the peak flow analysis utilized by the Rational method.
Full Course and Free Book
-

SSA Stormwater Book and Practice Files
Course4.9 average rating (31 reviews)This pdf book includes the training manual and practice files for the advanced AutoCAD Civil 3D Storm and Sanitary Design course. This manual covers the skills needed to successfully design and analyze stormwater detention and sanitary sewer systems.
Purchase$19.99
-

Civil 3D Storm And Sanitary Analysis
Course4.9 average rating (14 reviews)In this Online Storm and Sanitary Analysis (SSA) training course, participants will learn and apply the tools offered by SSA, the Civil 3D companion software for stormwater management and design.
$99 / year