-
Get It
$19.99
$19.99SSA Stormwater Book and Practice Files
Storm and Sanitary Design Tutorial: SSA subbasins
Stormwater Subbasins
Product: Autodesk SSA | Subject: Storm and Sanitary Analysis
In this exercise, we will learn about SSA subbasins.
Defining Subbasins
 We need to understand the site flow pattern for both the pre- and post-development conditions.
Once we have delineated the watershed (or catchment) boundaries, we then need to determine the catchment characteristics such as the time of concentration, soil characteristics, the ratio of pervious vs. impervious areas, etc. Fortunately, in this instance, we don’t have much drafting work to do, since we automatically imported our subbasins from Civil 3D. However, we need to define their characteristics. The characteristic we will need to define here is the Time of Concentration for each Subbasin. This
will depend on a lot of parameters.
- Open the file 04.02-SEWERS-Hydrology-Catchments.SPF , or keep working with the previous file.
- Double-click on Subbasins in the Data Tree.
- In the new window, we have three main tabs. This depends on the Hydrologic Methods and Time of Concentration we chose in the Project Options section earlier. Let’s start with the Physical Properties tab. On this tab, the primary information, which is the Subbasin area, is automatically calculated from Civil 3D. The remaining parameters will also be filled in as we work through the other tabs in this window.
- Next, click on the SCS TR-55 TOC tab. Here we need to provide the required information to compute the time of concentration. Once again, in hydrology, the TOC is the time required for the entire sub-basin to contribute to the flow at the outlet point. This is the time it takes a drop of water to travel from the furthest point to the outlet location. As you can see, this depends on several factors. Let’s determine them one by one.
The TR-55 method categorizes this flow into three types:
-
Sheet flow: This is the component of the runoff when water flows over the ground as a thin and even layer. This occurs in the headwaters of a Subbasin, meaning in the first 100 feeton average for small watersheds. In the sheet flow portion of the time of concentration, we need to determine the following parameters:
- First, the Manning’s n of the cover. This is not the same manning roughness we set earlier in Civil 3D for our HDPE pipe. To determine the correct Manning n for the sub-basin, we can click on the ellipsis (small 3 dots) to the right and check the table.
- In the next table, let's choose Urban Residential development with 3 to 10 Buildings per acres. Our development has about 49 townhouse units sitting on about 5 acres, which gives us 9 Units per acre. So, we will use a Manning roughness of 0.20, which corresponds to 3 – 10 building units per acre.
- Then, close the Manning’s Roughness window to return to the Subbasins window.
- Next, we need to define the flow length. To do that click on the ellipsis to the right.
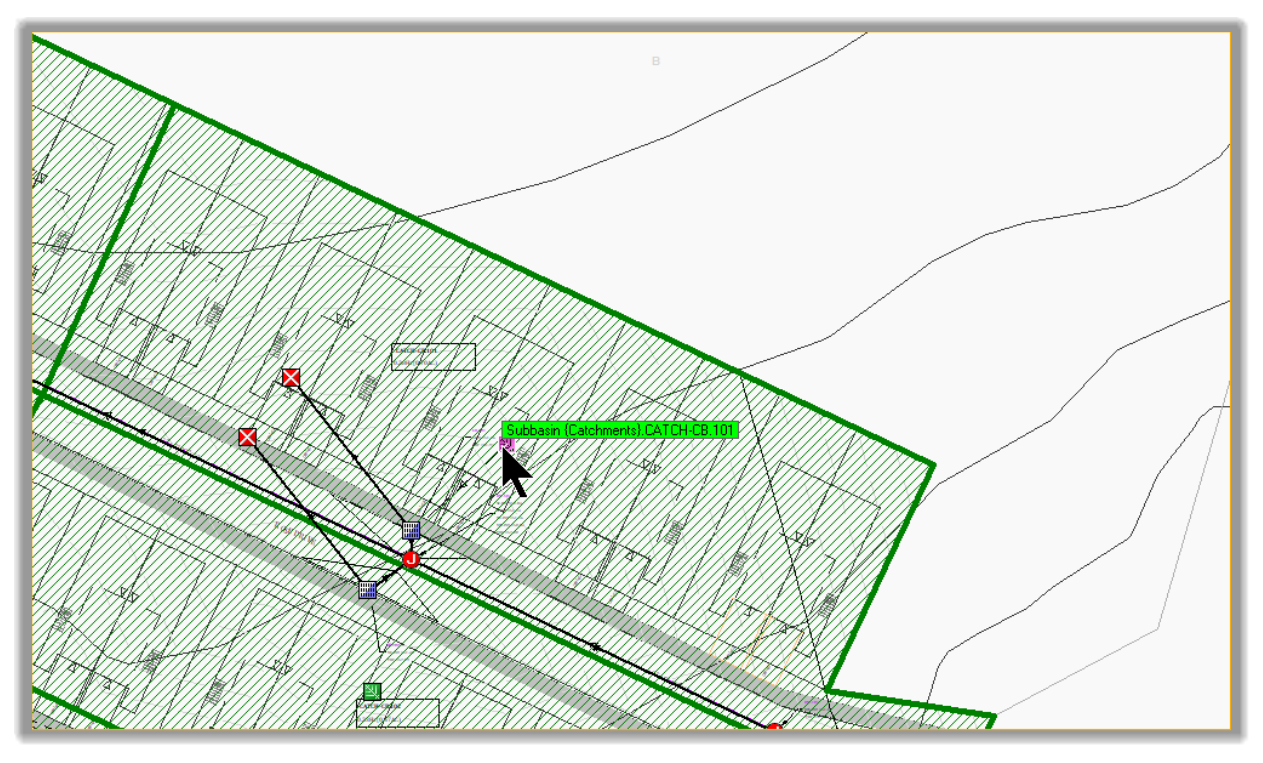
- In the plan view, zoom to the first catchment in our list, which is CATCH-CB.101, and draw a line from the furthest point to the catchbasin, with a flow pattern similar to this. When you get to the catchbasin, double-click to end the flow path.

- The estimated flow length is about 70.5m (230ft). Since we are limiting the sheet flow portion of the flow path to 30m or 100ft, we only need to enter 30m or 100ft in this box. We will then report the remaining 40.5m or 130ft as Shallow Concentrated Flow. So, let’s change the value to 30m or 100ft.
- Next, we need to input the slope. We can have it from our design ground surface in Civil 3D. Say we have an average of 2.5% slope for our site. Let’s use that value for all our sub-catchment. Each individual sub-catchment has its own slope, but overall, the average slope will balance things out.
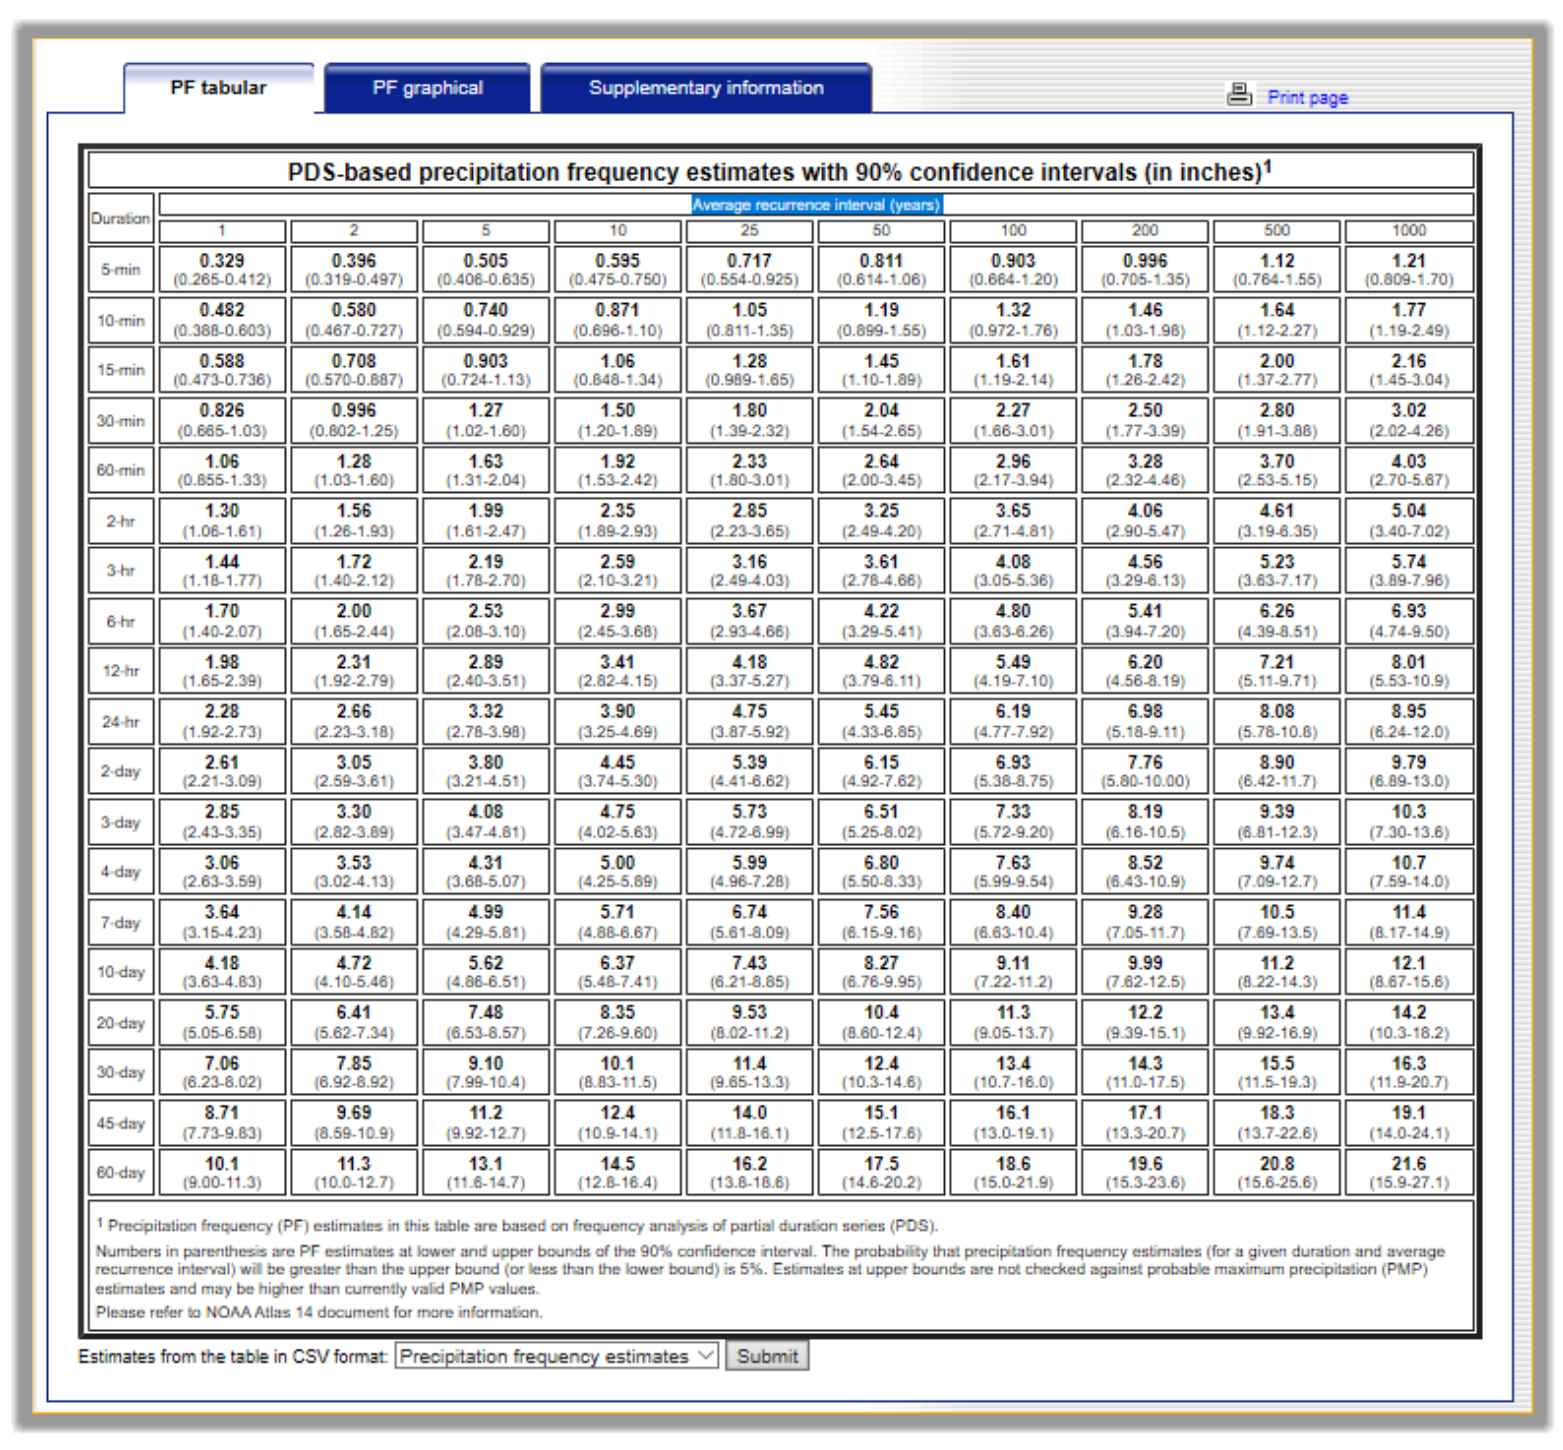
- Then, we need to input the cumulative value of the 2-year 24-hour rainfall. Once again, if our site is located in the US, we can click on the ellipsis and determine the value from the rainfall window, using the state and county data.
- We should note the 5.25 value is in inches rather than millimeter. So, if your project is in metric, you should not use this table. If you are working with the metric version of the practice file, simply cancel and enter the 2-year 24-hour rainfall data for your region.
- You can go to your local environment agency and consult the historical rainfall information and plug-in the data you receive. Such an example is Environment Canada, which has IDF and rainfall information for the entire country.
- Another great source of historical precipitation data is NOAA, which has data for the entire US.
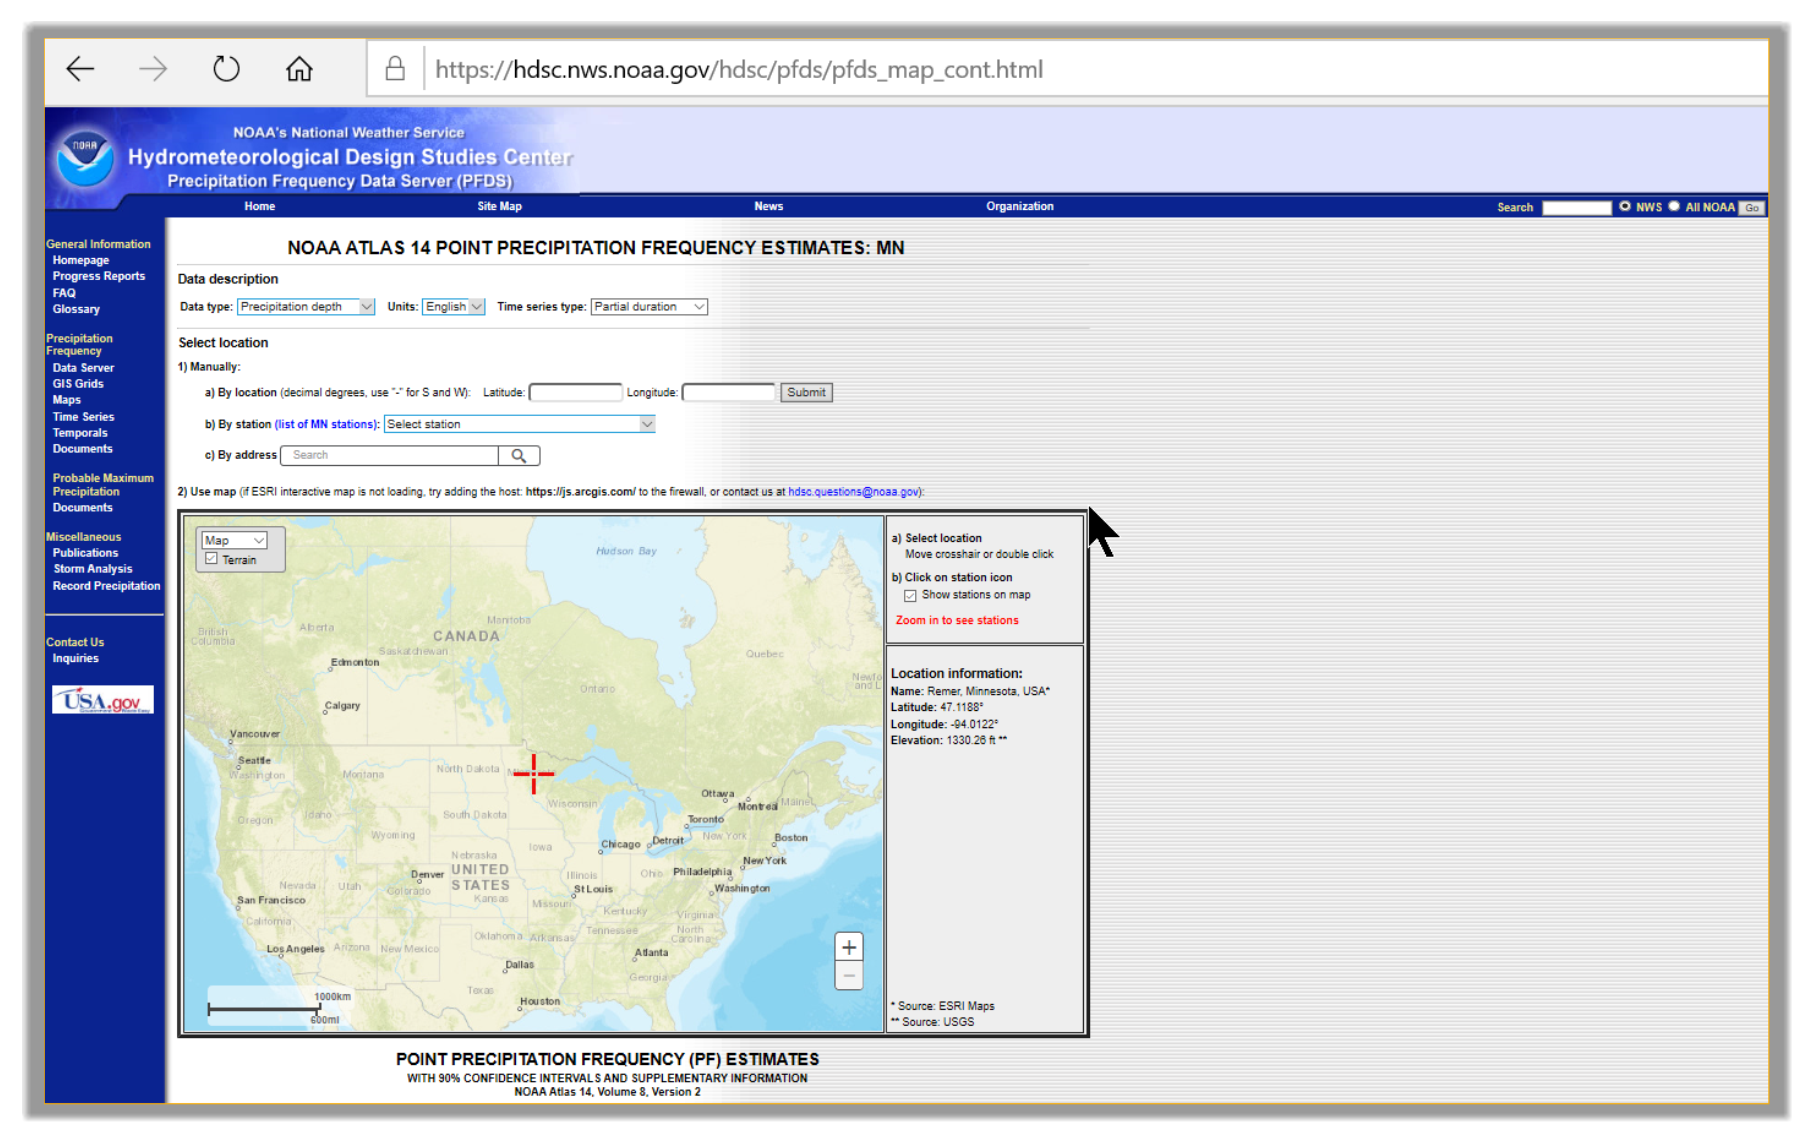
- With frequencies up to a 1,000-year return period, in case you are building a dam or something that needs to withstand the test of time.
- One last example of a rainfall data source is the Australian Bureau of Meteorology.
For rainfall data, please use the resources provided by your local government climate department.
- Once we have our 2-year 24-hour rainfall value, however, we obtain them, we can come back to the time of concentration window and input the data. In this instance, let’s enter the 120mm or 5in as the cumulative value for the 2-year 24-hour rainfall.
- Once we enter that value, we can notice that SSA automatically computes the Sheet Flow portion of the time of concentration for us (14.20 min). We should also mention that it is not required to have all three types of flows (Sheet, Shallow Concentrated, and Channel) in order to compute the time of concentration if the flow length is less than 30m or 100ft. For some small sites like minor parking lots, we can have only a Sheet Flow.
- Let’s also note that we will not subdivide our catchment into subareas since this option is mainly for large catchment areas. An example of when we would need more subareas may be in the case of large subbasins that have subareas draining into each other.
- Next, we need to estimate the Shallow Concentrated Flow portion of the time of concentration. The Flow Length would be from the end of the 30m or 100ft sheet flow to the pond or pipe inlet. This value will be the distance from the furthest point minus the sheet flow distance. Remember, in this instance, we have a total length of 70.5m (230ft). Therefore, we have 40.5m (130ft) more to go in Shallow Concentrated Flow Condition. So, let’s add that value in the Flow Length box.
- For Slope, let’s use the average slope of 2.5%.
- Then, for the surface type, for our post-development conditions, let's choose Paved. If we were in a pre-development condition or in a sub-catchment consisting of landscaping, for example, we could choose the Unpaved surface type or one of the other surface covers. Our table should look as shown. Notice that we’ve added 0.69min more to the time of concentration, as the contribution of the Shallow Concentrated Flow portion.
- In the next tab, we have the options for Channel Flow. This option should be only used when we have actual data for a stream channel that has been surveyed. When using Channel Flow, we will be required to enter the cross-section information. In the current instance, we will ignore it, as we don’t have any contribution from that type of flow.
- On the Last tab, we can see a summary report of the Time of Concentration calculation. This tab gives us a summation of all three types of flows.
- Next, switch to the Runoff Coefficient (C factor) tab. To determine the C value, let’s click on the ellipsis in the Runoff Coefficient column.
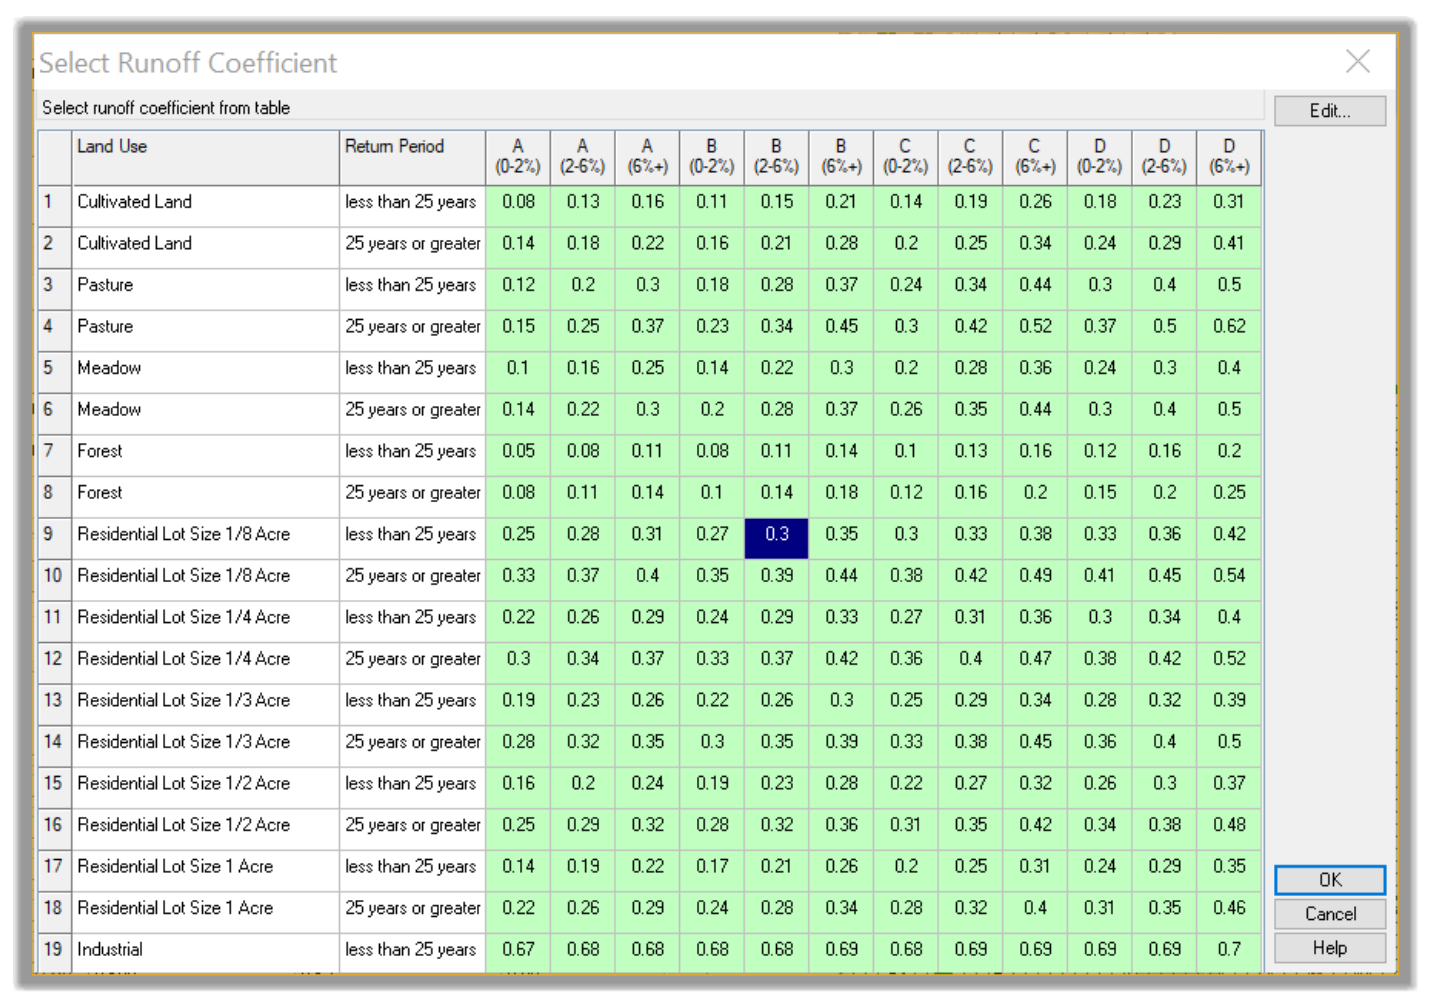
- In the “Select Runoff Coefficient” table, we have a guideline for C-factor values depending on the Land Use, Site Slope, and the Soil Group. We already know the Land Use and the Site Slope. All we need, to know the C factor, is to determine the soil group. The process of determining the Soil Group is almost similar to that of the rainfall information. Once again, the best way is to consult online government resources or geotechnical site studies. An example of a few resources for determining the soil type is the USDA Soils Survey for soil information in the United States. User can create very accurate maps, up to the house or street level, through the interactive website map portal:
- First, visit the websoil map portal. You can simply do a Google search for “USGS soils data” or visit the following link.
https://websoilsurvey.sc.egov.usda.gov/App/WebSoilSurvey.aspx
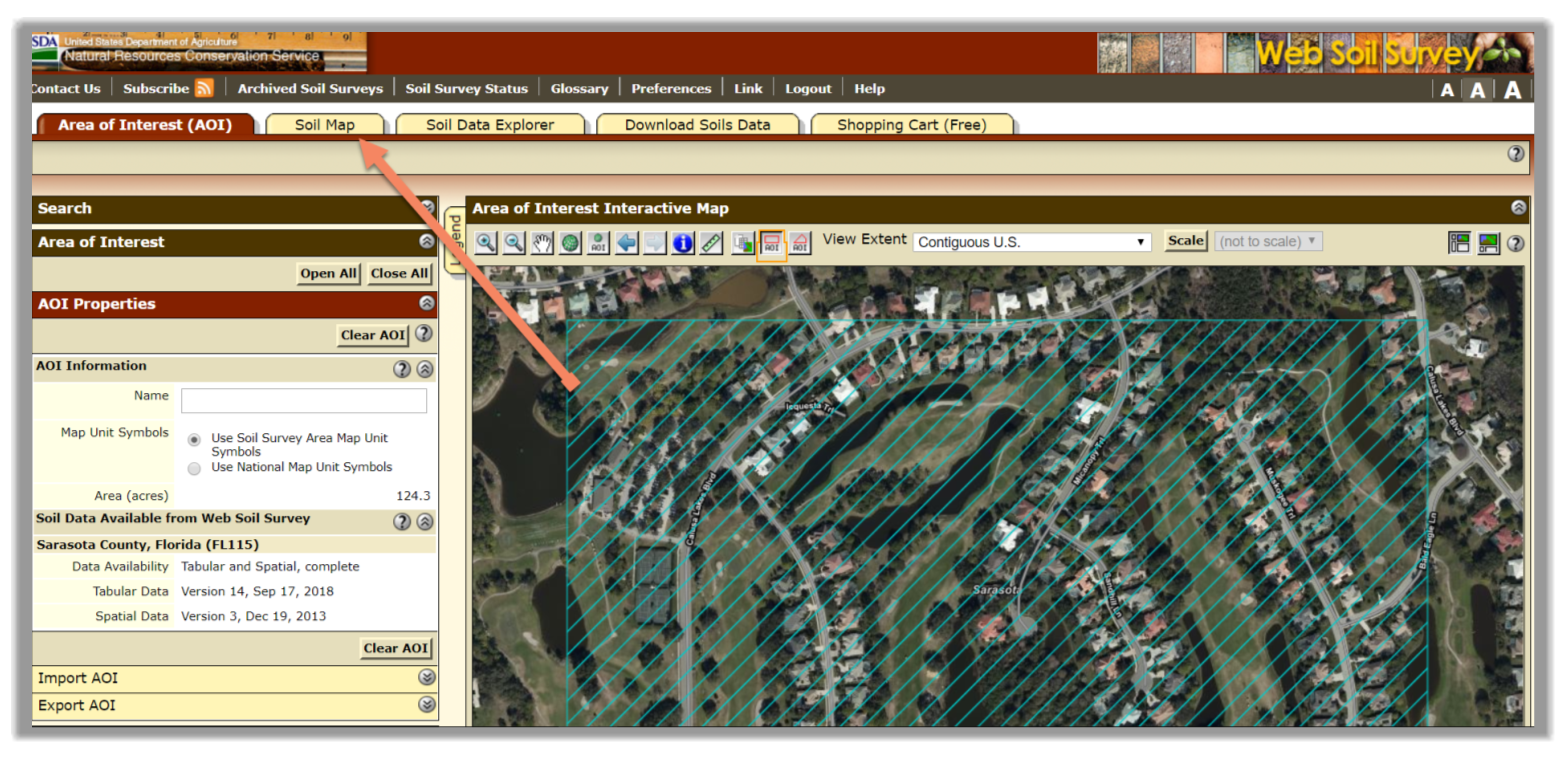
- Once there, click on Start WSS
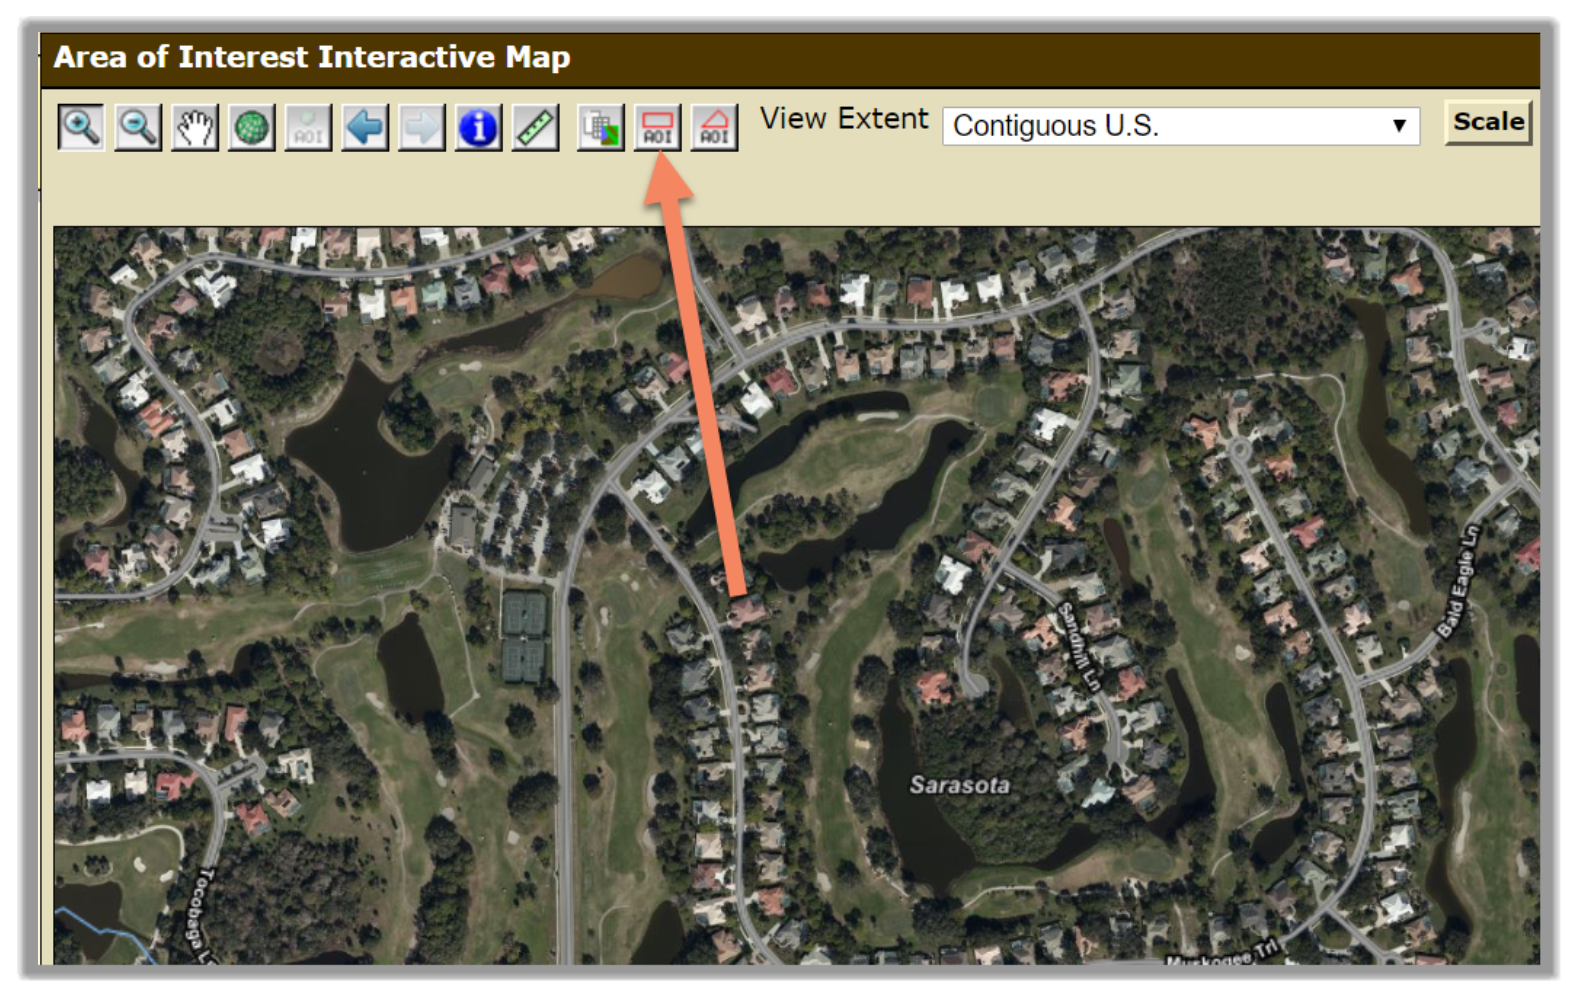
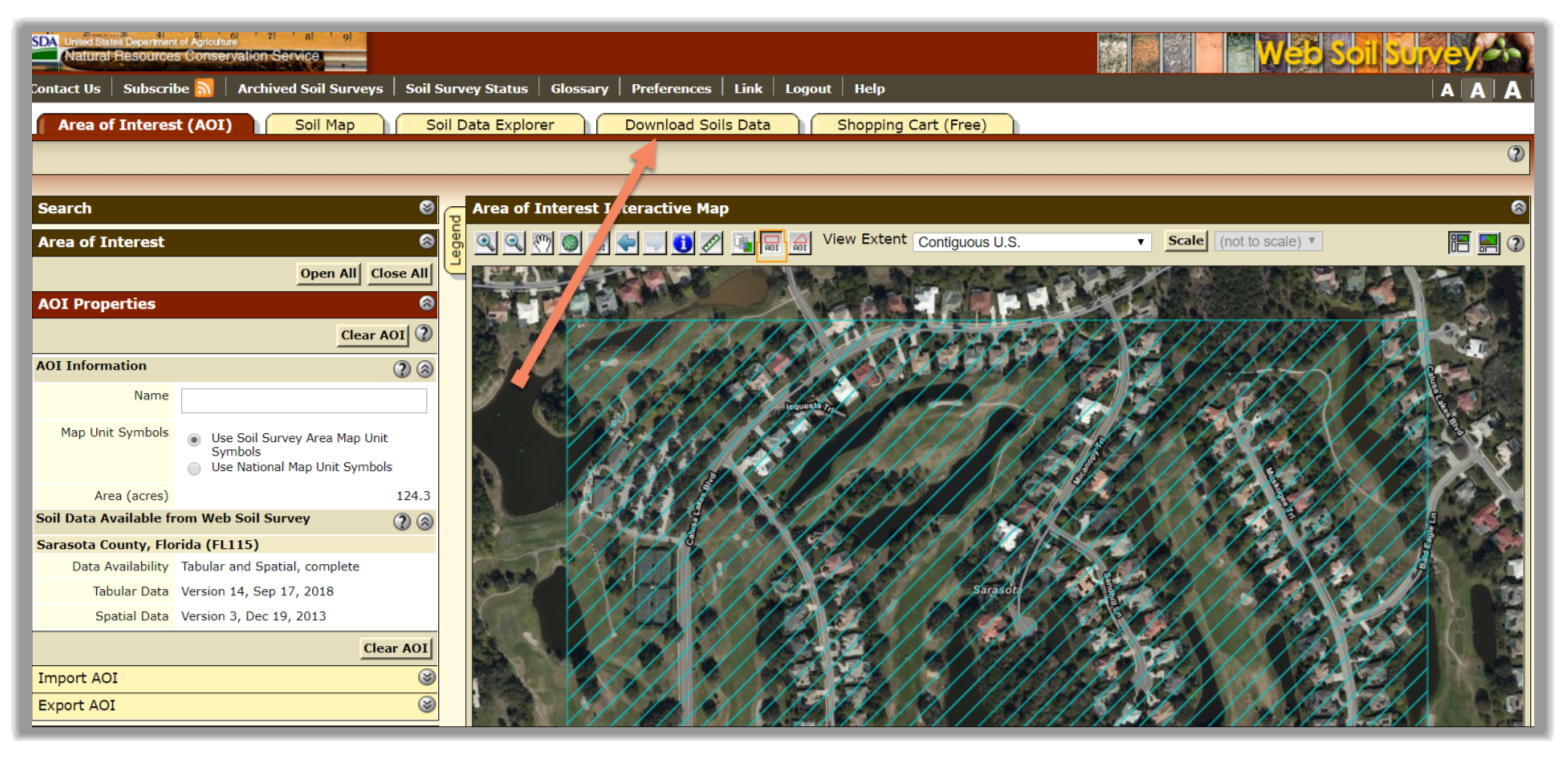
- Next, zoom to your project location and create an AOI (Area of Interest)
- Then, define the AOI by rectangle or polygon.
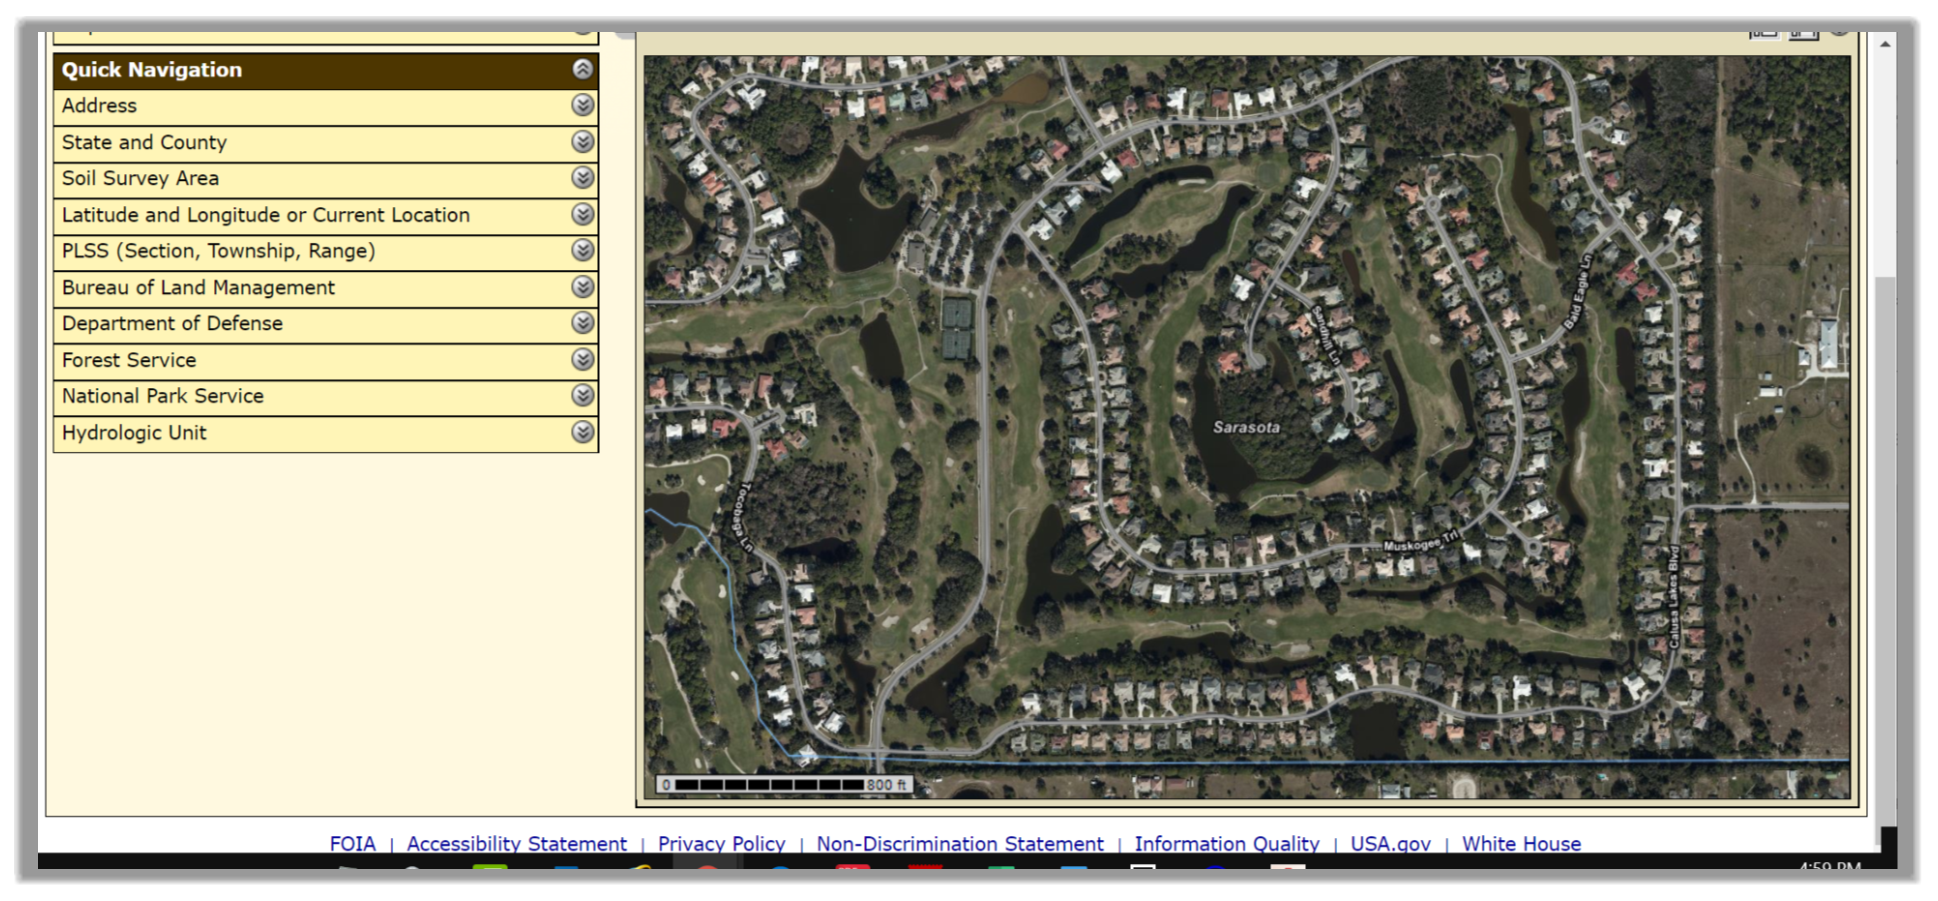
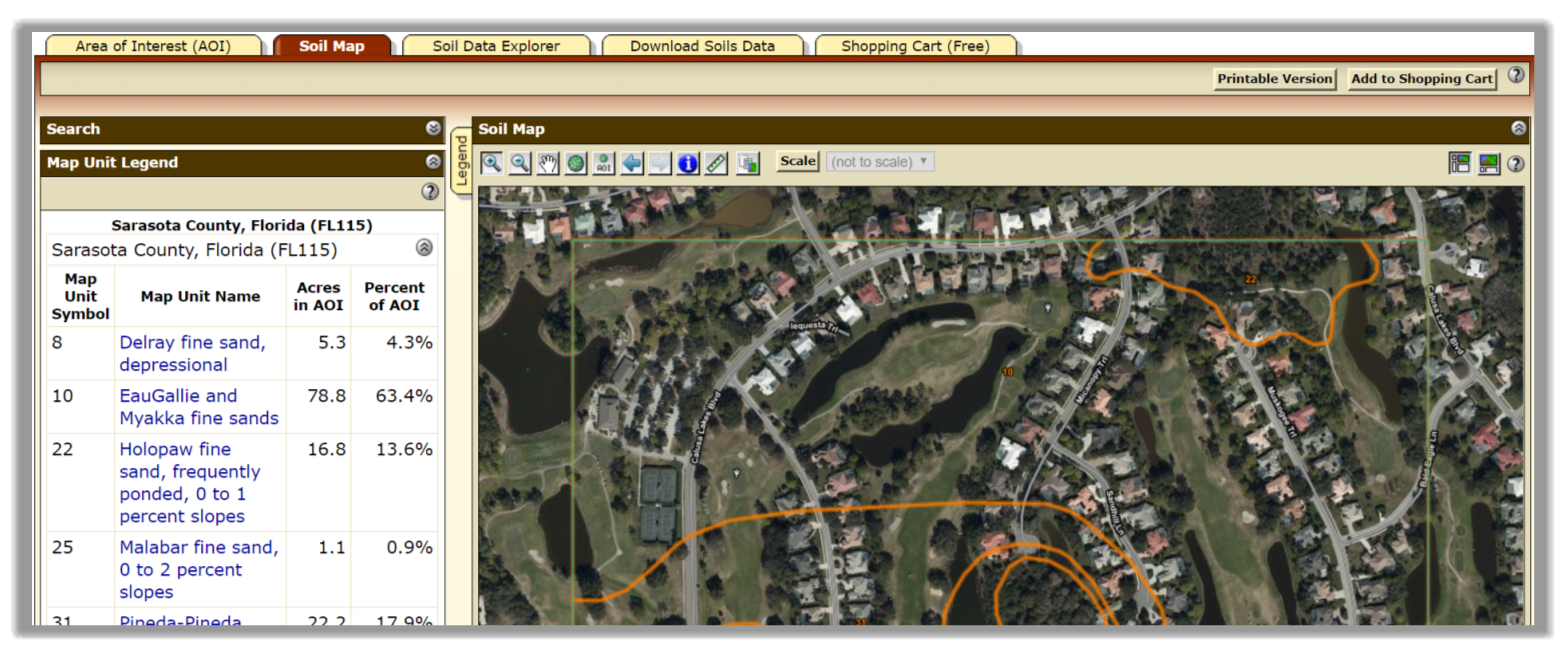
- Now that we have defined the Area Of Interest, we can read the soils types information by clicking on the “Soil Map” tab.

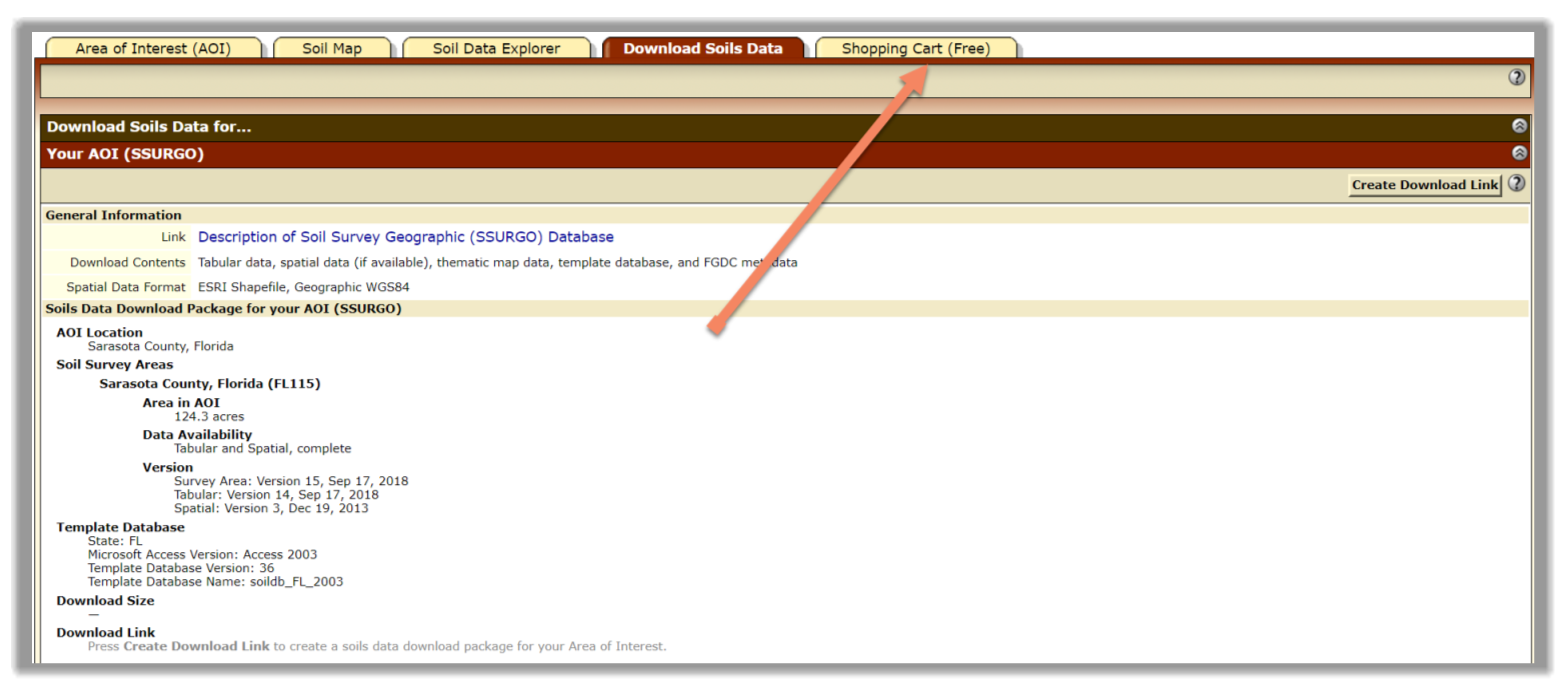
- Or, we can download the soil map for reporting and documentation purposes, by clicking on the “Download Soils Data” tab.
- Next, click on “Shopping Cart (Free)”. As indicated by the name, the products in this cart will be free to download.
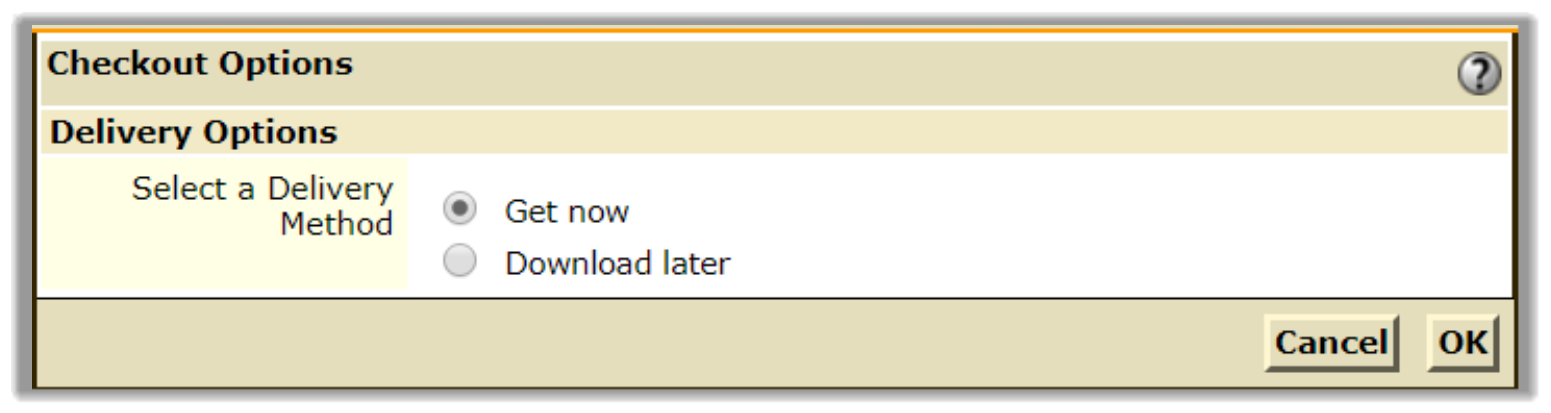
- Next, click on “Checkout.”
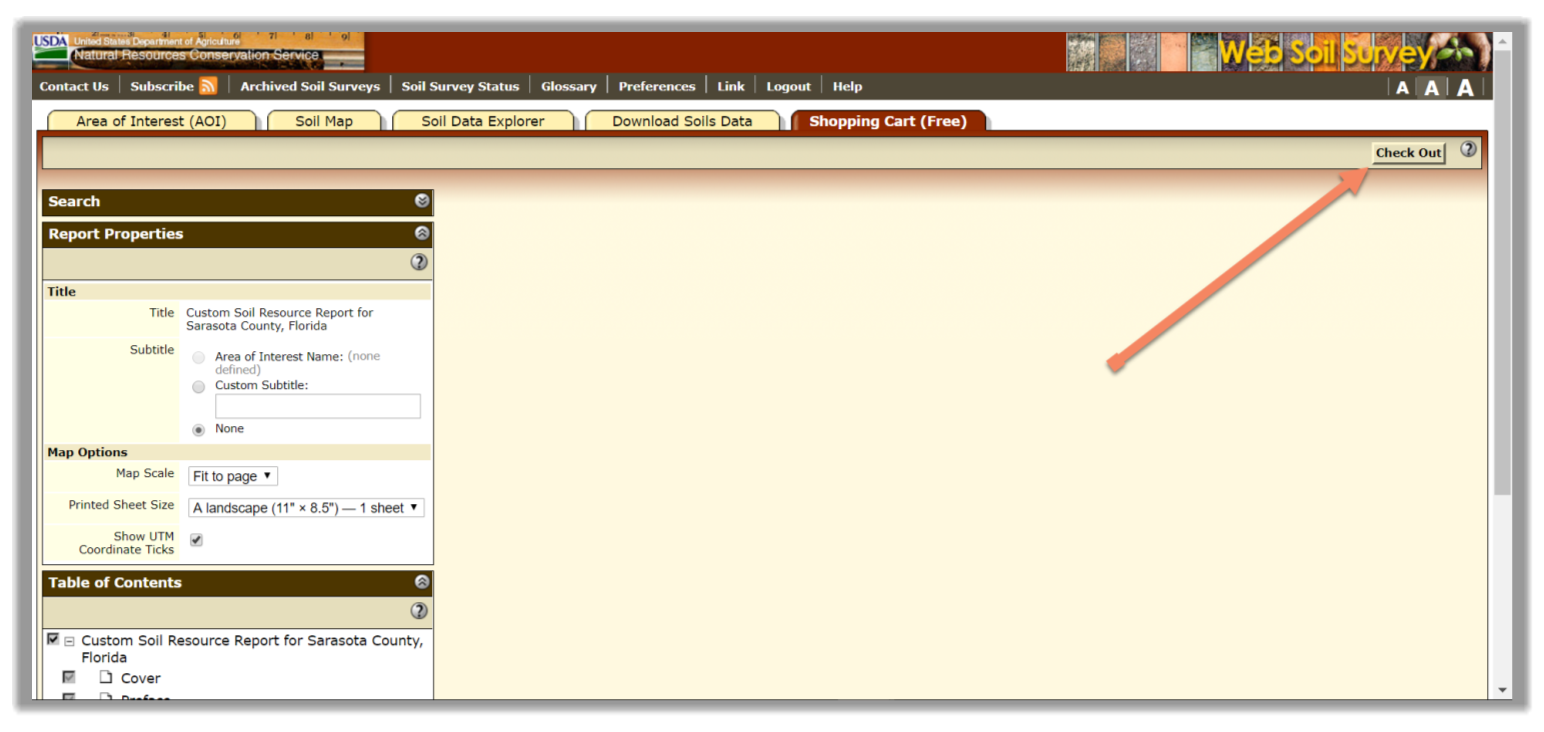
- Then select “Get Now” and click OK.
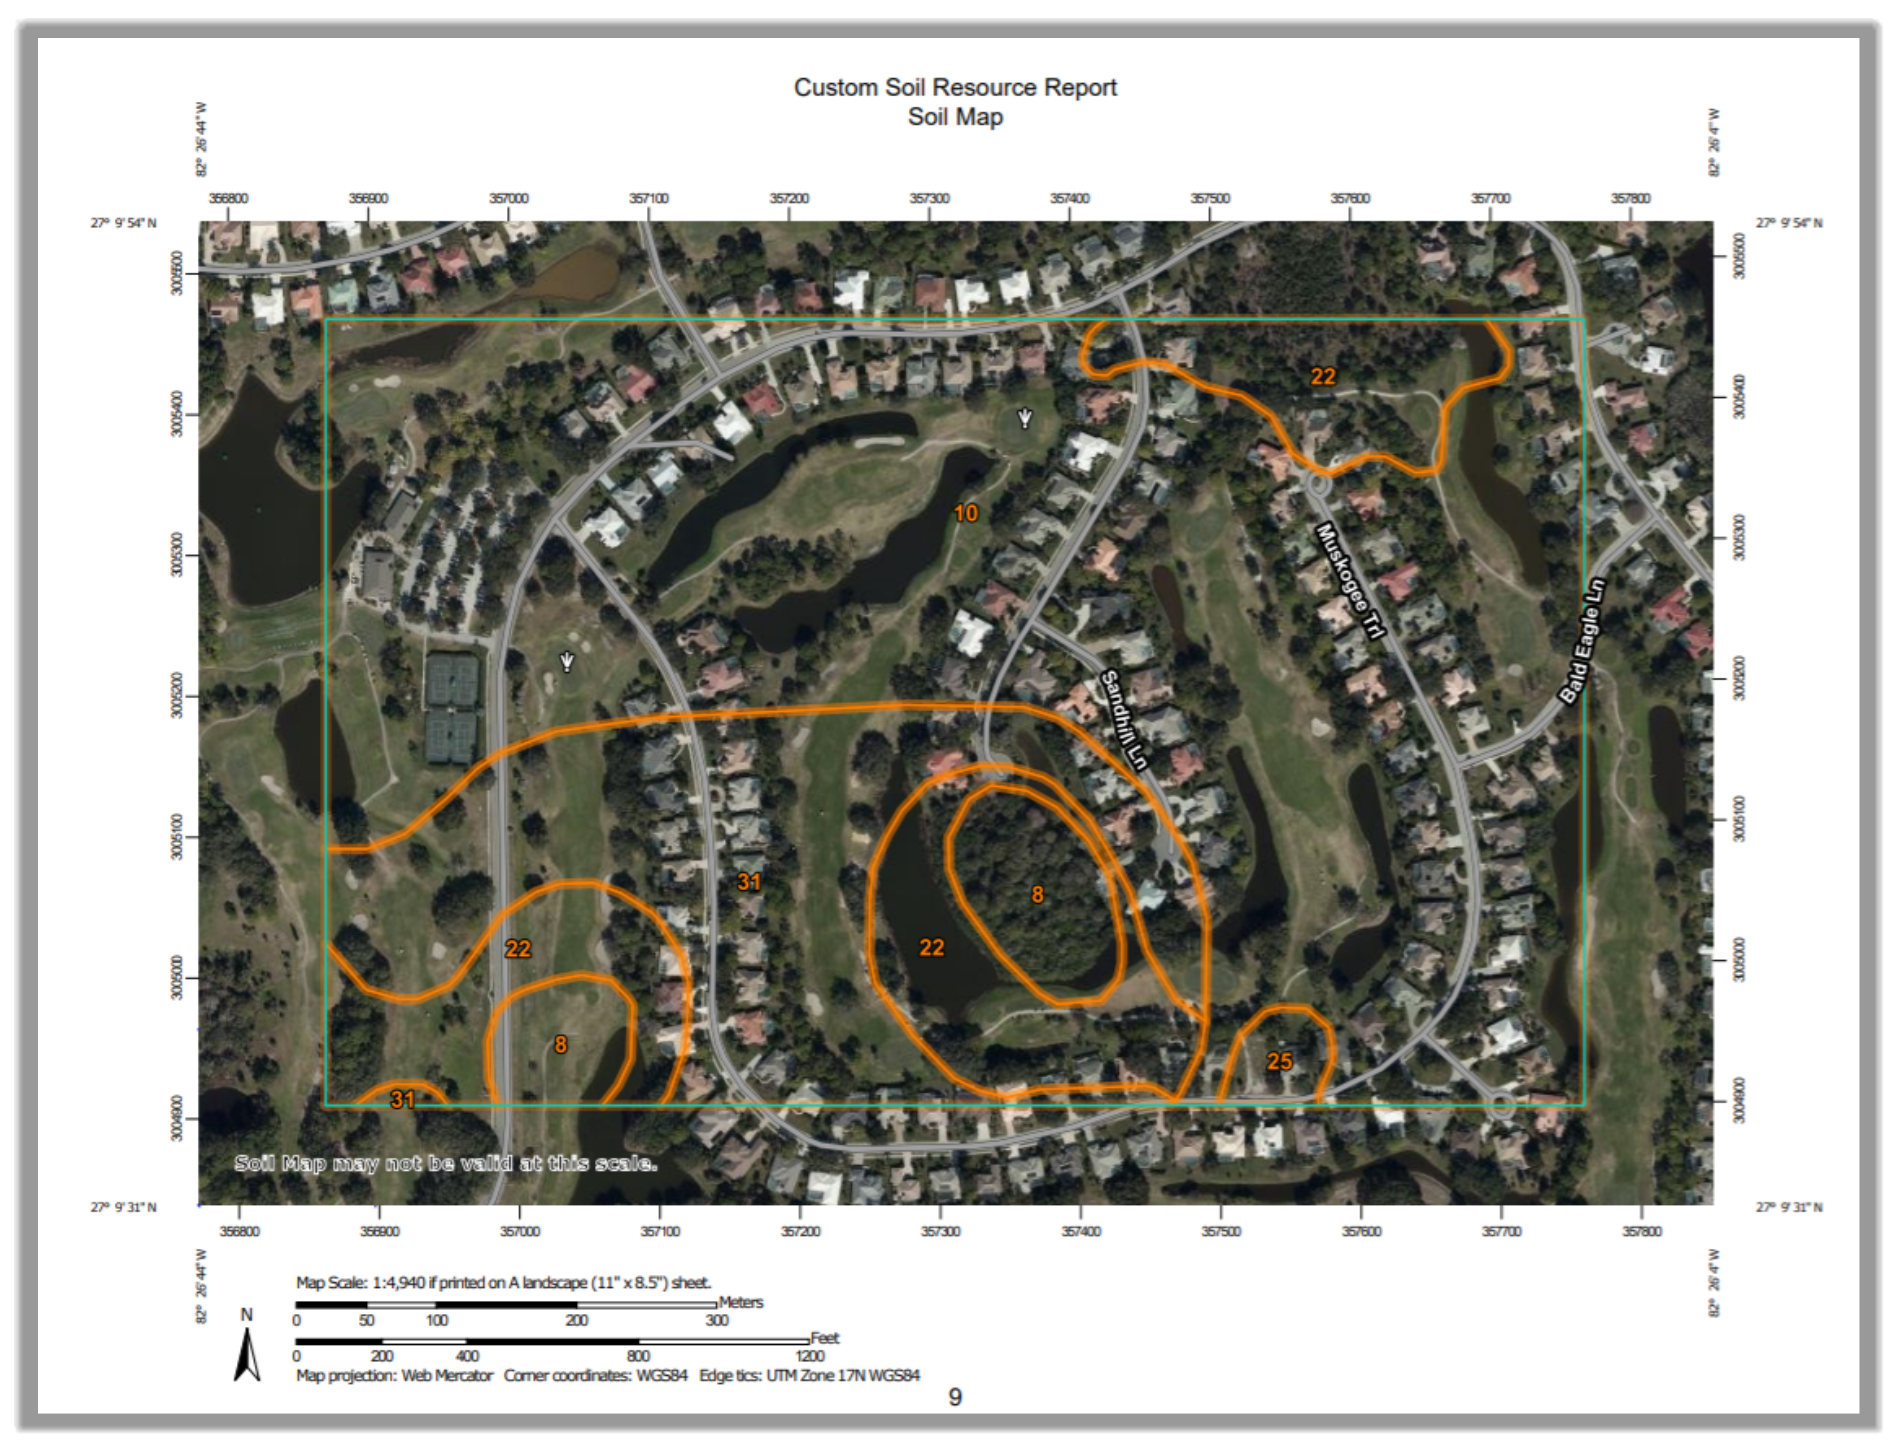
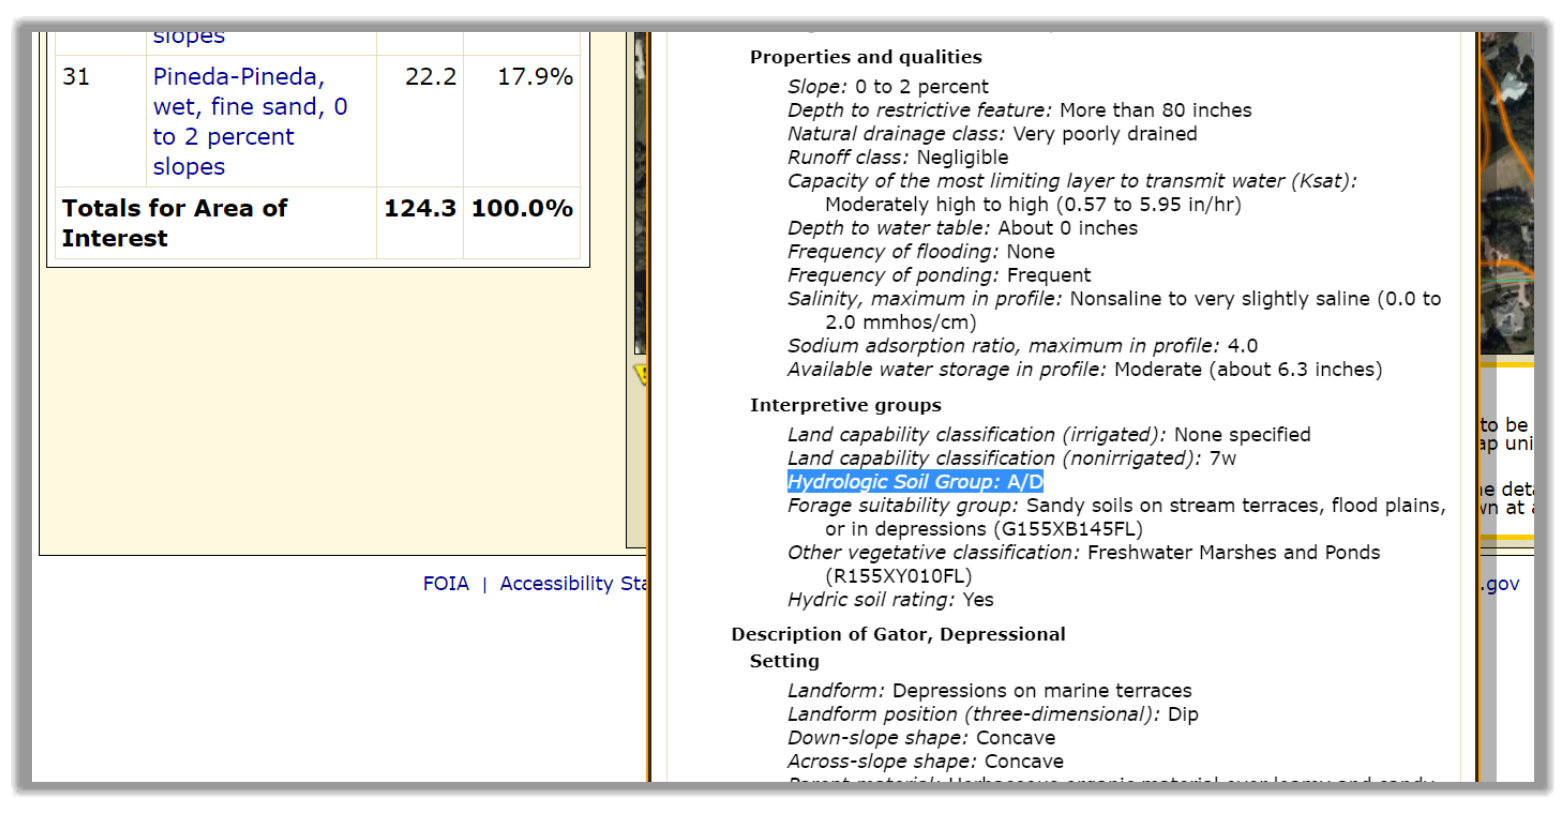
- We now have a full-fledged soil report with Maps, Group Unit, descriptions, reference, and more. In the report for each soil, we have a Hydrologic Soil Group A, B, C, or D.
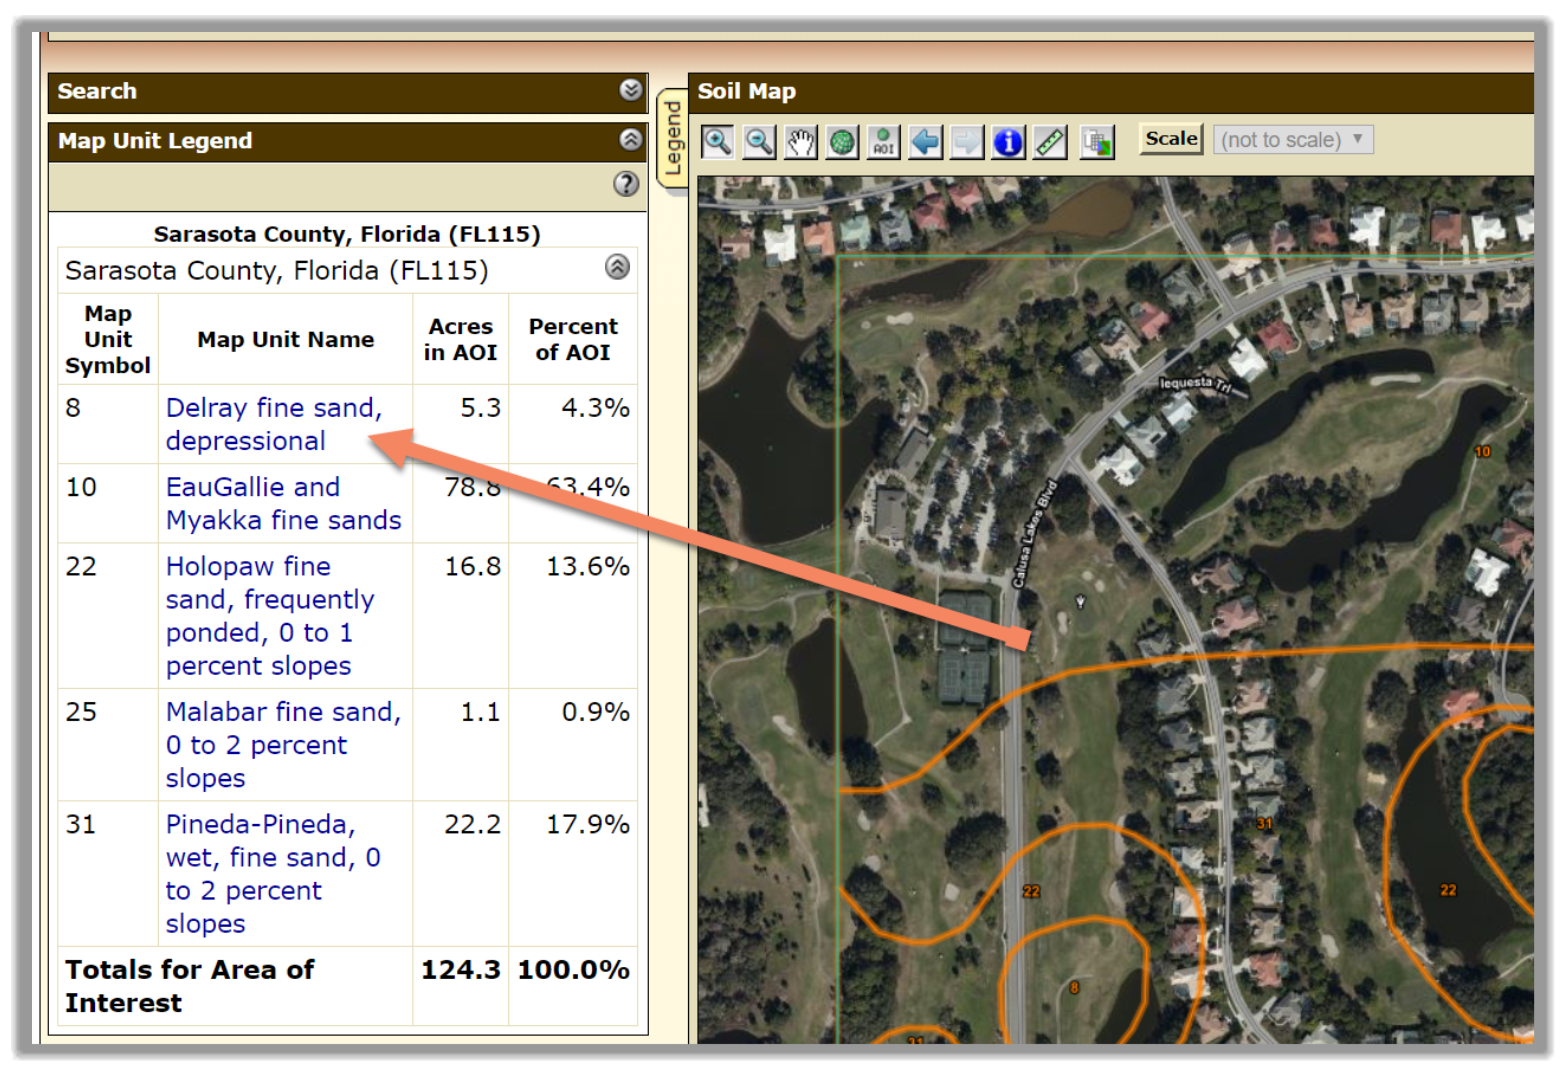
- Alternatively, we don’t need to create a full-fledged report. We can read the different soils groups on the map and use them in SSA. To determine the soils group.
- Click on “Soil Map”
- From there, click on each soil type to determine its Group.
- Next, it would be a good idea to create a spreadsheet to keep a record of the soil groups and their percentage over the total area.
- Other sources of extensive soil databases are:
The Canadian National Soil Database (NSDB)
http://sis.agr.gc.ca/cansis/nsdb/index.html
The European Soil Data Centre (ESDAC), which have been collecting and providing soils information for most countries in the world:
https://esdac.jrc.ec.europa.eu/resource-type/national-soil-maps-eudasm
- We can categorize our site’s soils as one of the four Soil groups (A, B, C, D) directly from the soil report or by correlating it to the soil group description in the National Engineering Handbook (included in the course resources).

- It is then just a matter of using the Soil Group and Land Use to determine the C-factor from the Runoff Coefficient table or from the drainage handbook.
- Now, let’s go back to the Subbasins windows and the Runoff Coefficient tab.
- Once again, click on the ellipsis.
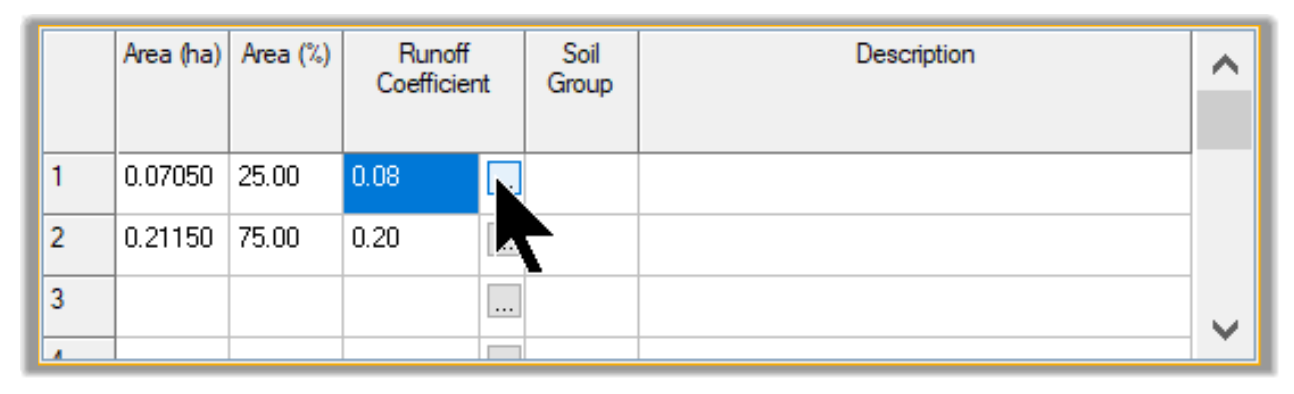
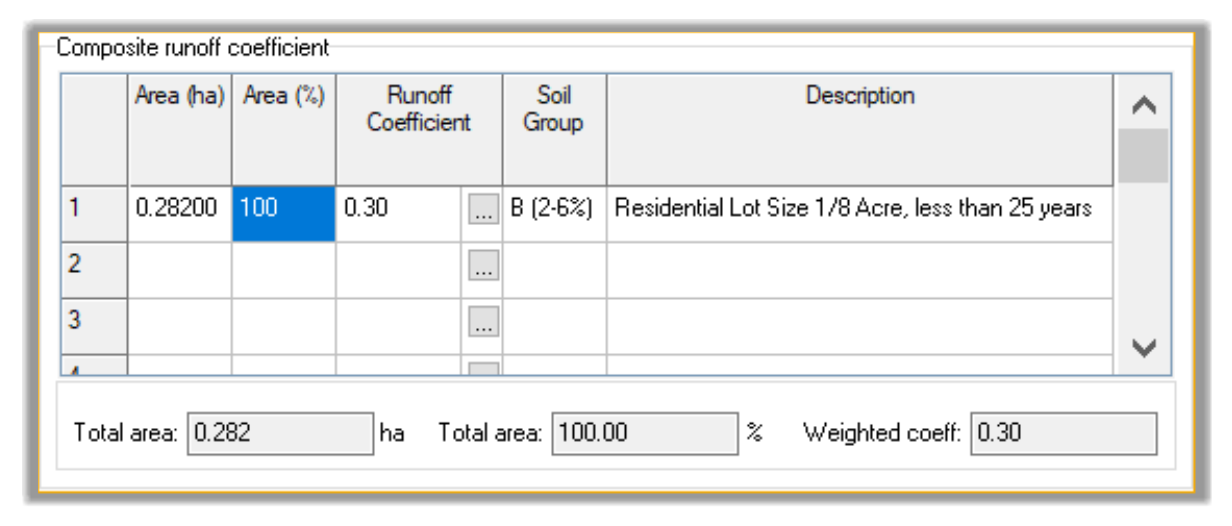
- Select the value corresponding to the Soil Group B we determined earlier using the USGS online map or other methods we suggested. Since we are in a residential district and are planning townhouses (1/8 acre lots), we should use a C-factor of 0.3.
- Click on OK, and the value will be entered automatically in the Runoff Coefficient text box, along with the right description.
- If we have a mix of soil groups, we can enter a line for each group. We, however, need to make sure that we assign the right Curve Number and that the summation of the areas equals the total sub-basin area, as specified on the physical properties tab. If we enter multiple Soil Groups, SSA will compute a weighted C-factor value for us.
- Now, let’s delete the second line and convert the first to a ratio of 100%. Click anywhere on the second line, right-Click and select Delete Row.
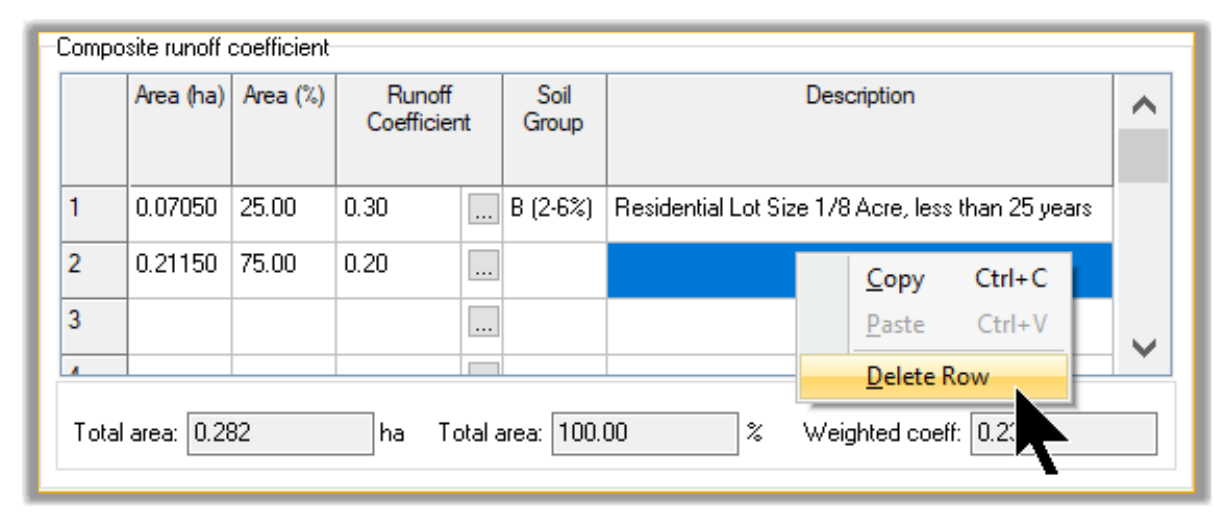
- Then, change the % of the area to 100.
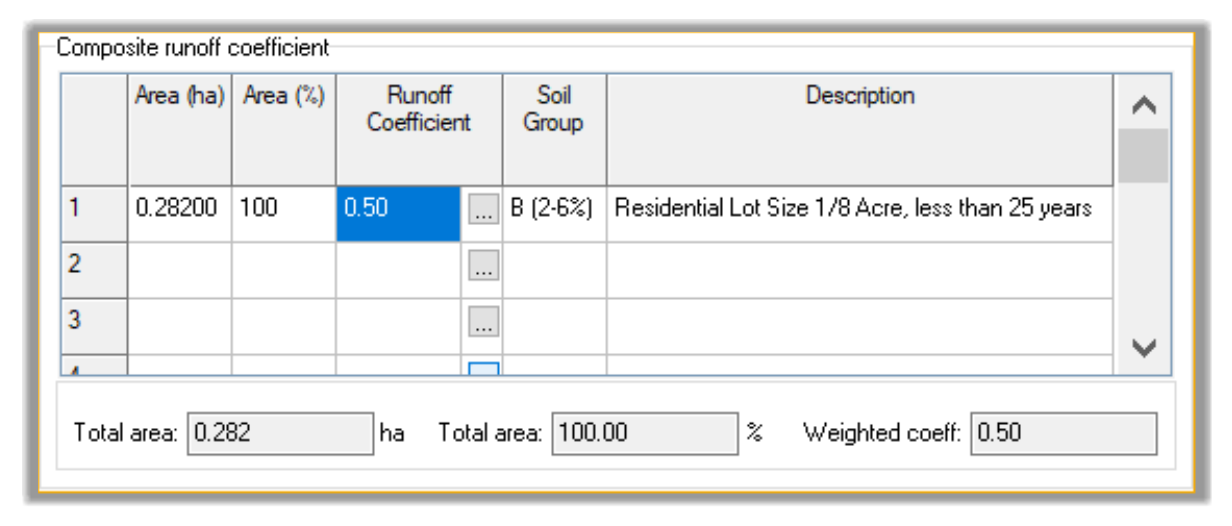
- Before we close this window, we need to mention that some municipalities will impose a minimum value of c-factor for post development conditions. If that’s the case, we need to bump up the C-factor to the minimum allowed, say 0.50.
- Click Close to dismiss the Subbasins window.
- Now is a good time to save your work.
- Remember, we don’t have to set up the characteristics for only Subbasin CATCH-CB.101.
- Next, we need to do the same thing for the other catchments. Fortunately, we can copy the characteristics of one Subbasin to another.
- To copy these parameters to all Catchments in our project,
- First, select the catchment we have set up.
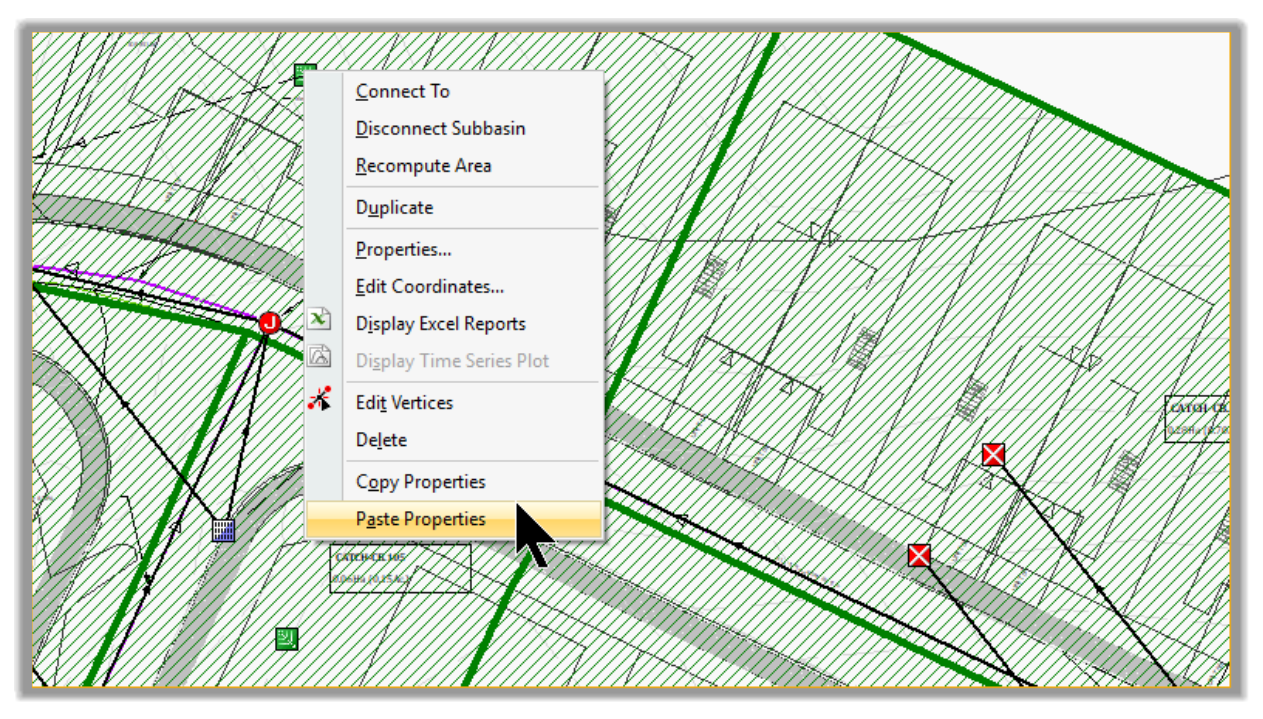
- Right-click and select Copy Properties.
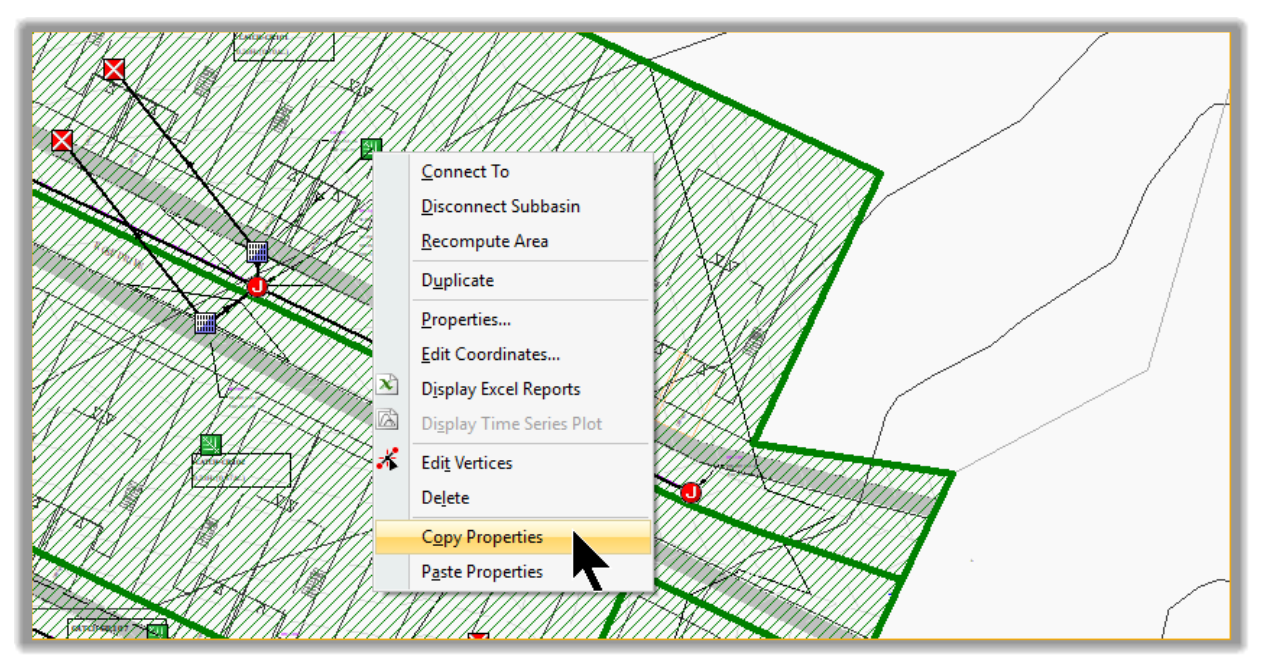
- Next, click on each one of the other catchments, right-click and select Paste Properties.
- Now we have the same C-factor for all catchments. However, we still need to set the flow length for each individual catchment. Let’s go through them and do that. Let’s start with Catchment CATCH-CB.102, then CATCH-CB.103, CATCH-CB.104, and so forth, until we reach CATCH-CB.111.
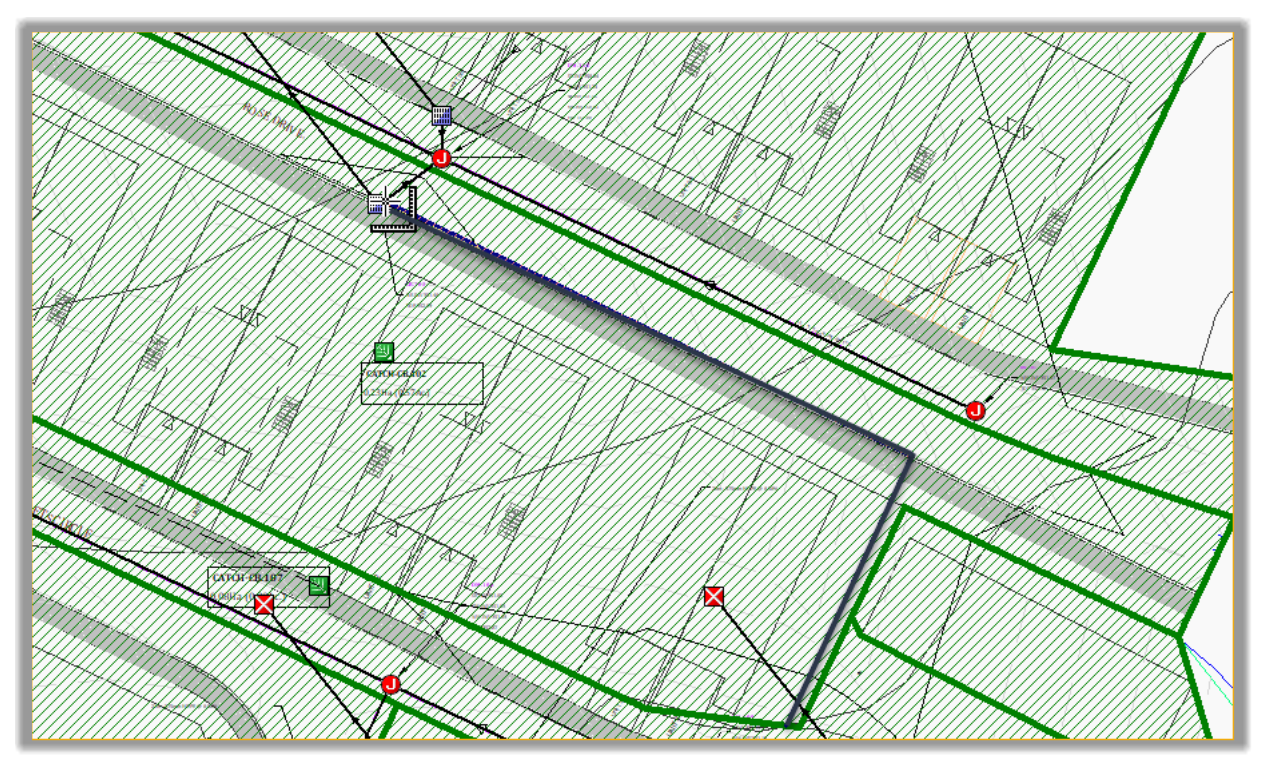
- Since we already have the Sheet Flow part at 30m (100ft), we simply need to measure and determine the Shallow Concentrated part. To do that we can simply measure the flow length and subtract the 30m (100ft) used by the Sheet flow.
- Once you have set the flow length for all Subbasin, you can dismiss the catchments window and save your progress.
Full Course and Free Book
-

SSA Stormwater Book and Practice Files
Course4.9 average rating (31 reviews)This pdf book includes the training manual and practice files for the advanced AutoCAD Civil 3D Storm and Sanitary Design course. This manual covers the skills needed to successfully design and analyze stormwater detention and sanitary sewer systems.
Purchase$19.99
-

Civil 3D Storm And Sanitary Analysis
Course4.9 average rating (14 reviews)In this Online Storm and Sanitary Analysis (SSA) training course, participants will learn and apply the tools offered by SSA, the Civil 3D companion software for stormwater management and design.
$99 / year