-
Get It
$19.99
$19.99SSA Stormwater Book and Practice Files
Storm and Sanitary Design Tutorial: Time Series Plot
SSA Time Series
Product: Autodesk SSA | Subject: Storm and Sanitary Analysis
In this exercise, we will learn about stormwater Time Series
Time Series Plot
Time series plots allow displaying the value of any output, for any location of the drainage network, on an x-axis timeline. They are commonly called Hydrograph plots.
To create a Time Series Plot:
- Keep working with the same file or open 06.02-ANALYSIS-Time Series.pdf, from the practice folder.
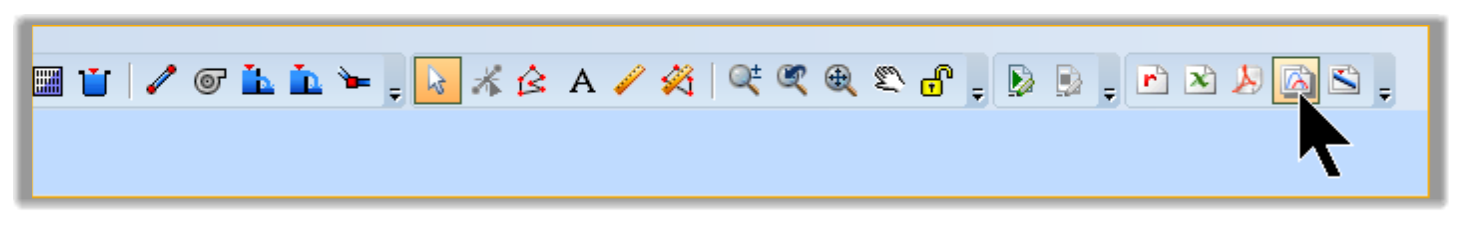
- Run the command from the menu bar.
- The output variable can be for Subbasins, Nodes, Links, or a system-wide variable.
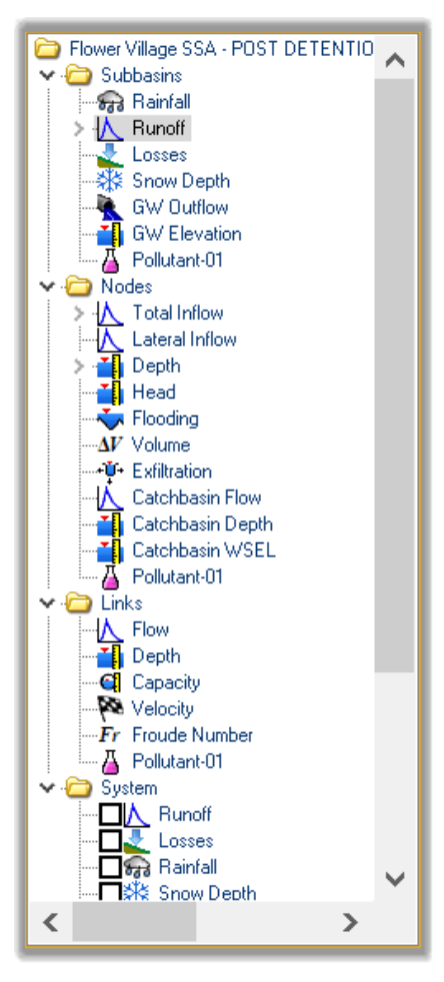 The Subbasins Variables include Groundwater Elevation, Groundwater Flow, Loss Rate, Rainfall Rate, Snow, and Water Quality.
The Node Variables include Exfiltration, flows, Volumes, Water Surface Elevations, etc.
In the Link section, we can plot variables such as flow rate, depth, etc.
Finally, System Variables are data such as Runoff, Losses, Rainfall, Snow Depth and many more.
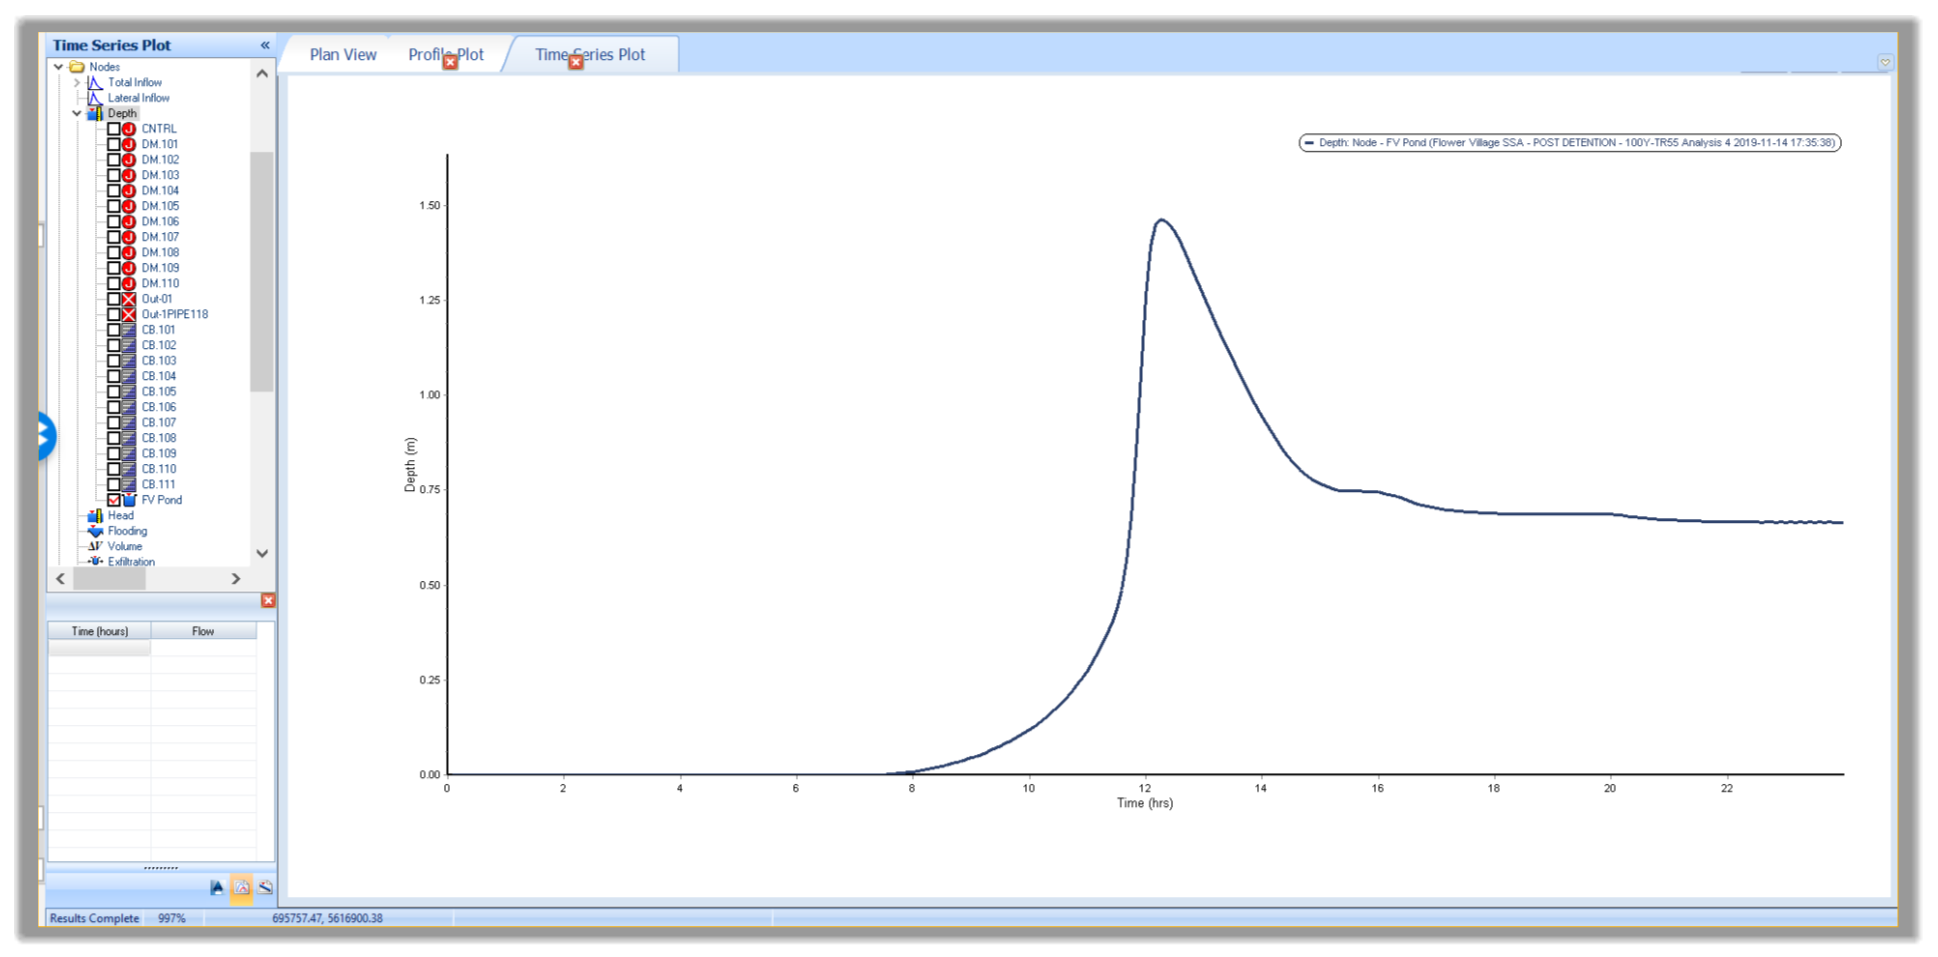
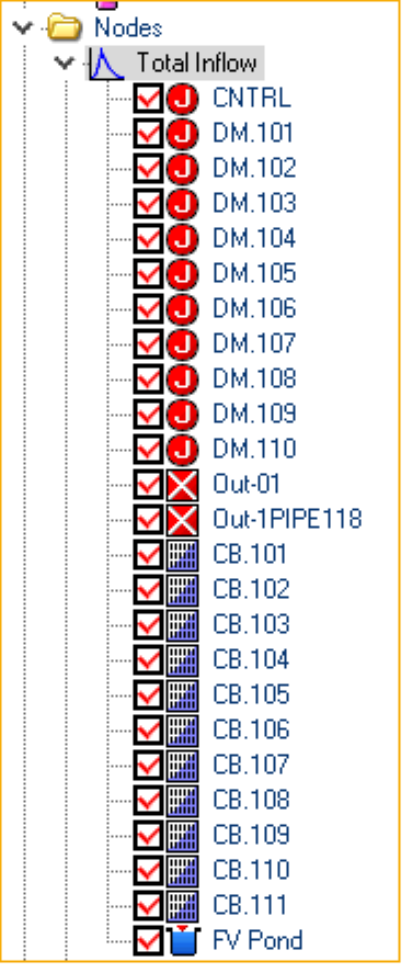
- Let’s plot a time series of the Pond depth. In the Time Series Plot section, navigate to the Nodes area, open the Depth section, and activate the Pond. The Time Series for the Pond Elevation is now displayed. We can see that the pond reaches its maximum elevation shortly after the 12th hour, subsides slowly to the orifice invert elevation, and stays at the water quality elevation from then on.
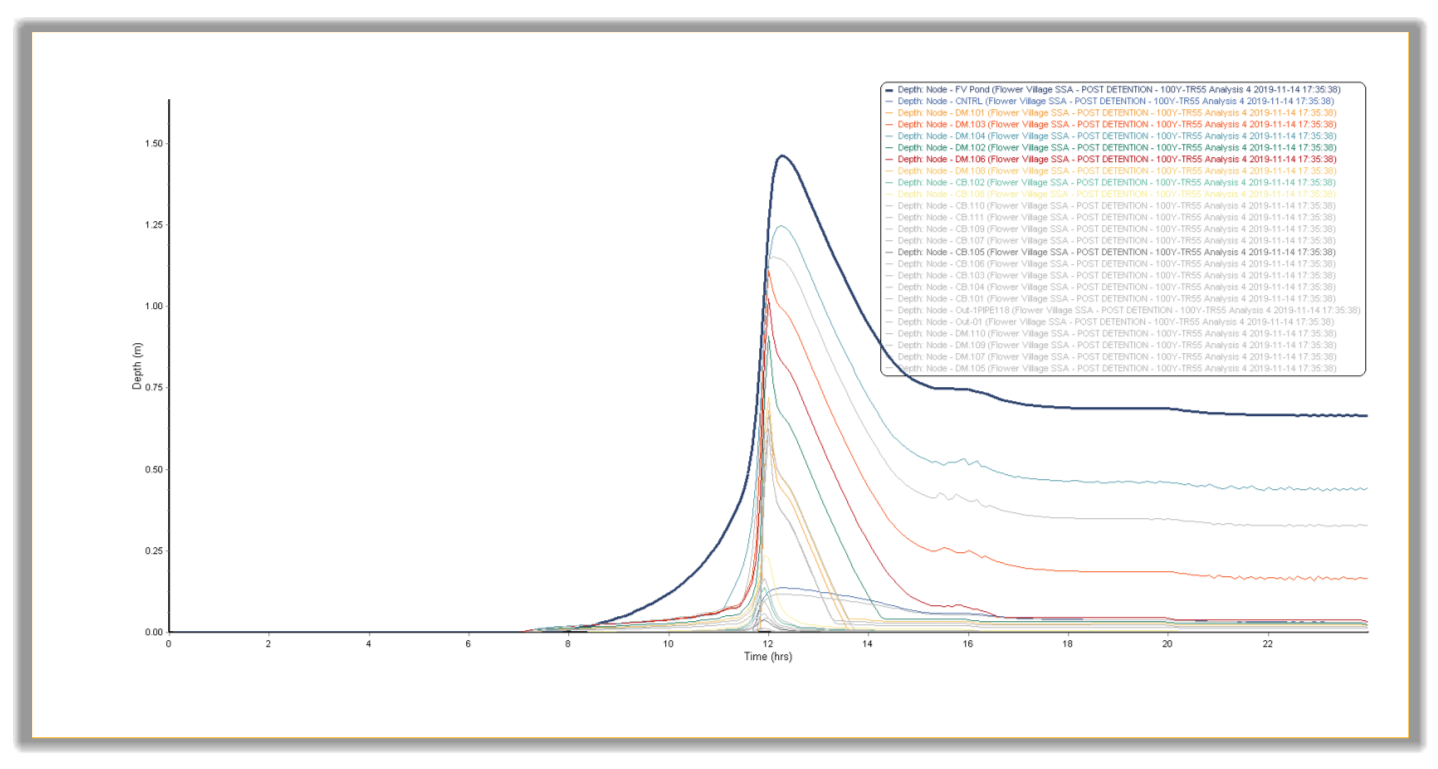
- We can add more plots to the display by selecting another variable, sometimes referred to as hydrograph plots. Lets keep clicking and add more Depth for the Manholes and CBs.
- Let’s also add the flow graphs. Click on each of the nodes you would like to show a graph for. Let’s go ahead and select as many nodes as we want. Notice how the profile plot is split to show both flows and depth in the same view.

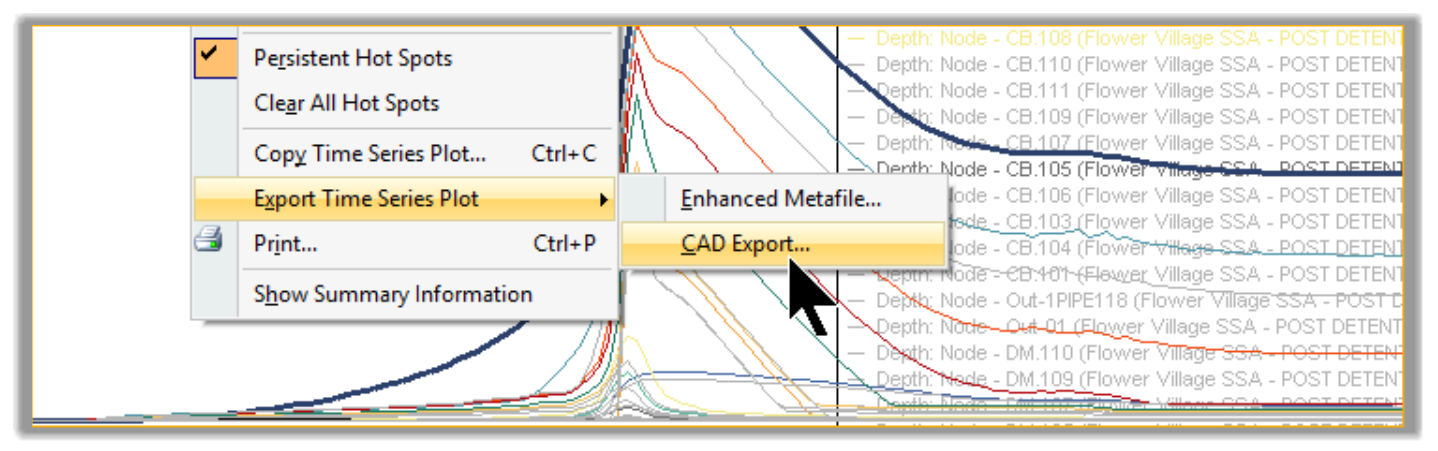
- Similarly, to Profile Plots, we can also export the time series plot to a CAD file or another desired output format. To do that, right-click and choose the desired option.
- This concludes the section on the Time Series plot. Next, we will see how to do Output Animations.
Full Course and Free Book
-

SSA Stormwater Book and Practice Files
Course4.9 average rating (31 reviews)This pdf book includes the training manual and practice files for the advanced AutoCAD Civil 3D Storm and Sanitary Design course. This manual covers the skills needed to successfully design and analyze stormwater detention and sanitary sewer systems.
Purchase$19.99
-

Civil 3D Storm And Sanitary Analysis
Course4.9 average rating (14 reviews)In this Online Storm and Sanitary Analysis (SSA) training course, participants will learn and apply the tools offered by SSA, the Civil 3D companion software for stormwater management and design.
$99 / year